
Image
|
Figure Caption
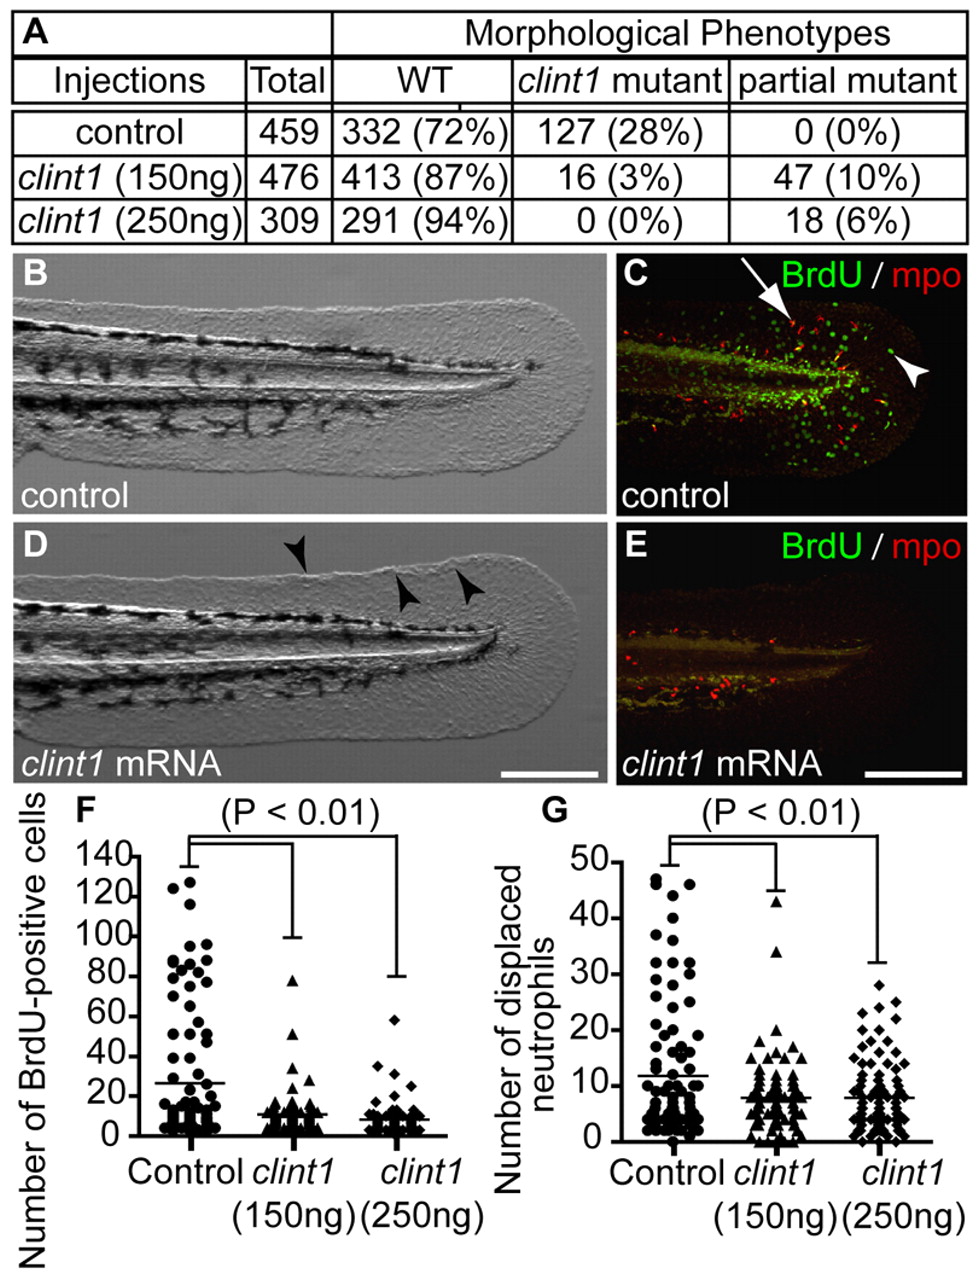
Fig. 4 Rescue of proliferation and inflammation by clint1 mRNA overexpression in clint1 mutants. (A-E) Data (A) and representative images of control-injected mutants (B,C) and clint1 mRNA-injected partial mutants (D,E) that were immunolabeled for BrdU (green, arrowhead) and Mpo (red, arrow) (C,E). Arrowheads (D) identify epidermal aggregation. (F,G) Quantification of proliferation (F) and neutrophil displacement (G) in control-injected (circles) and clint1 mRNA-injected (triangles, 150 ng/μl; diamonds, 250 ng/μl) embryos. Bars represent the mean. Scale bars: 200 μm.
Acknowledgments
This image is the copyrighted work of the attributed author or publisher, and
ZFIN has permission only to display this image to its users.
Additional permissions should be obtained from the applicable author or publisher of the image.
Full text @ Development