
|
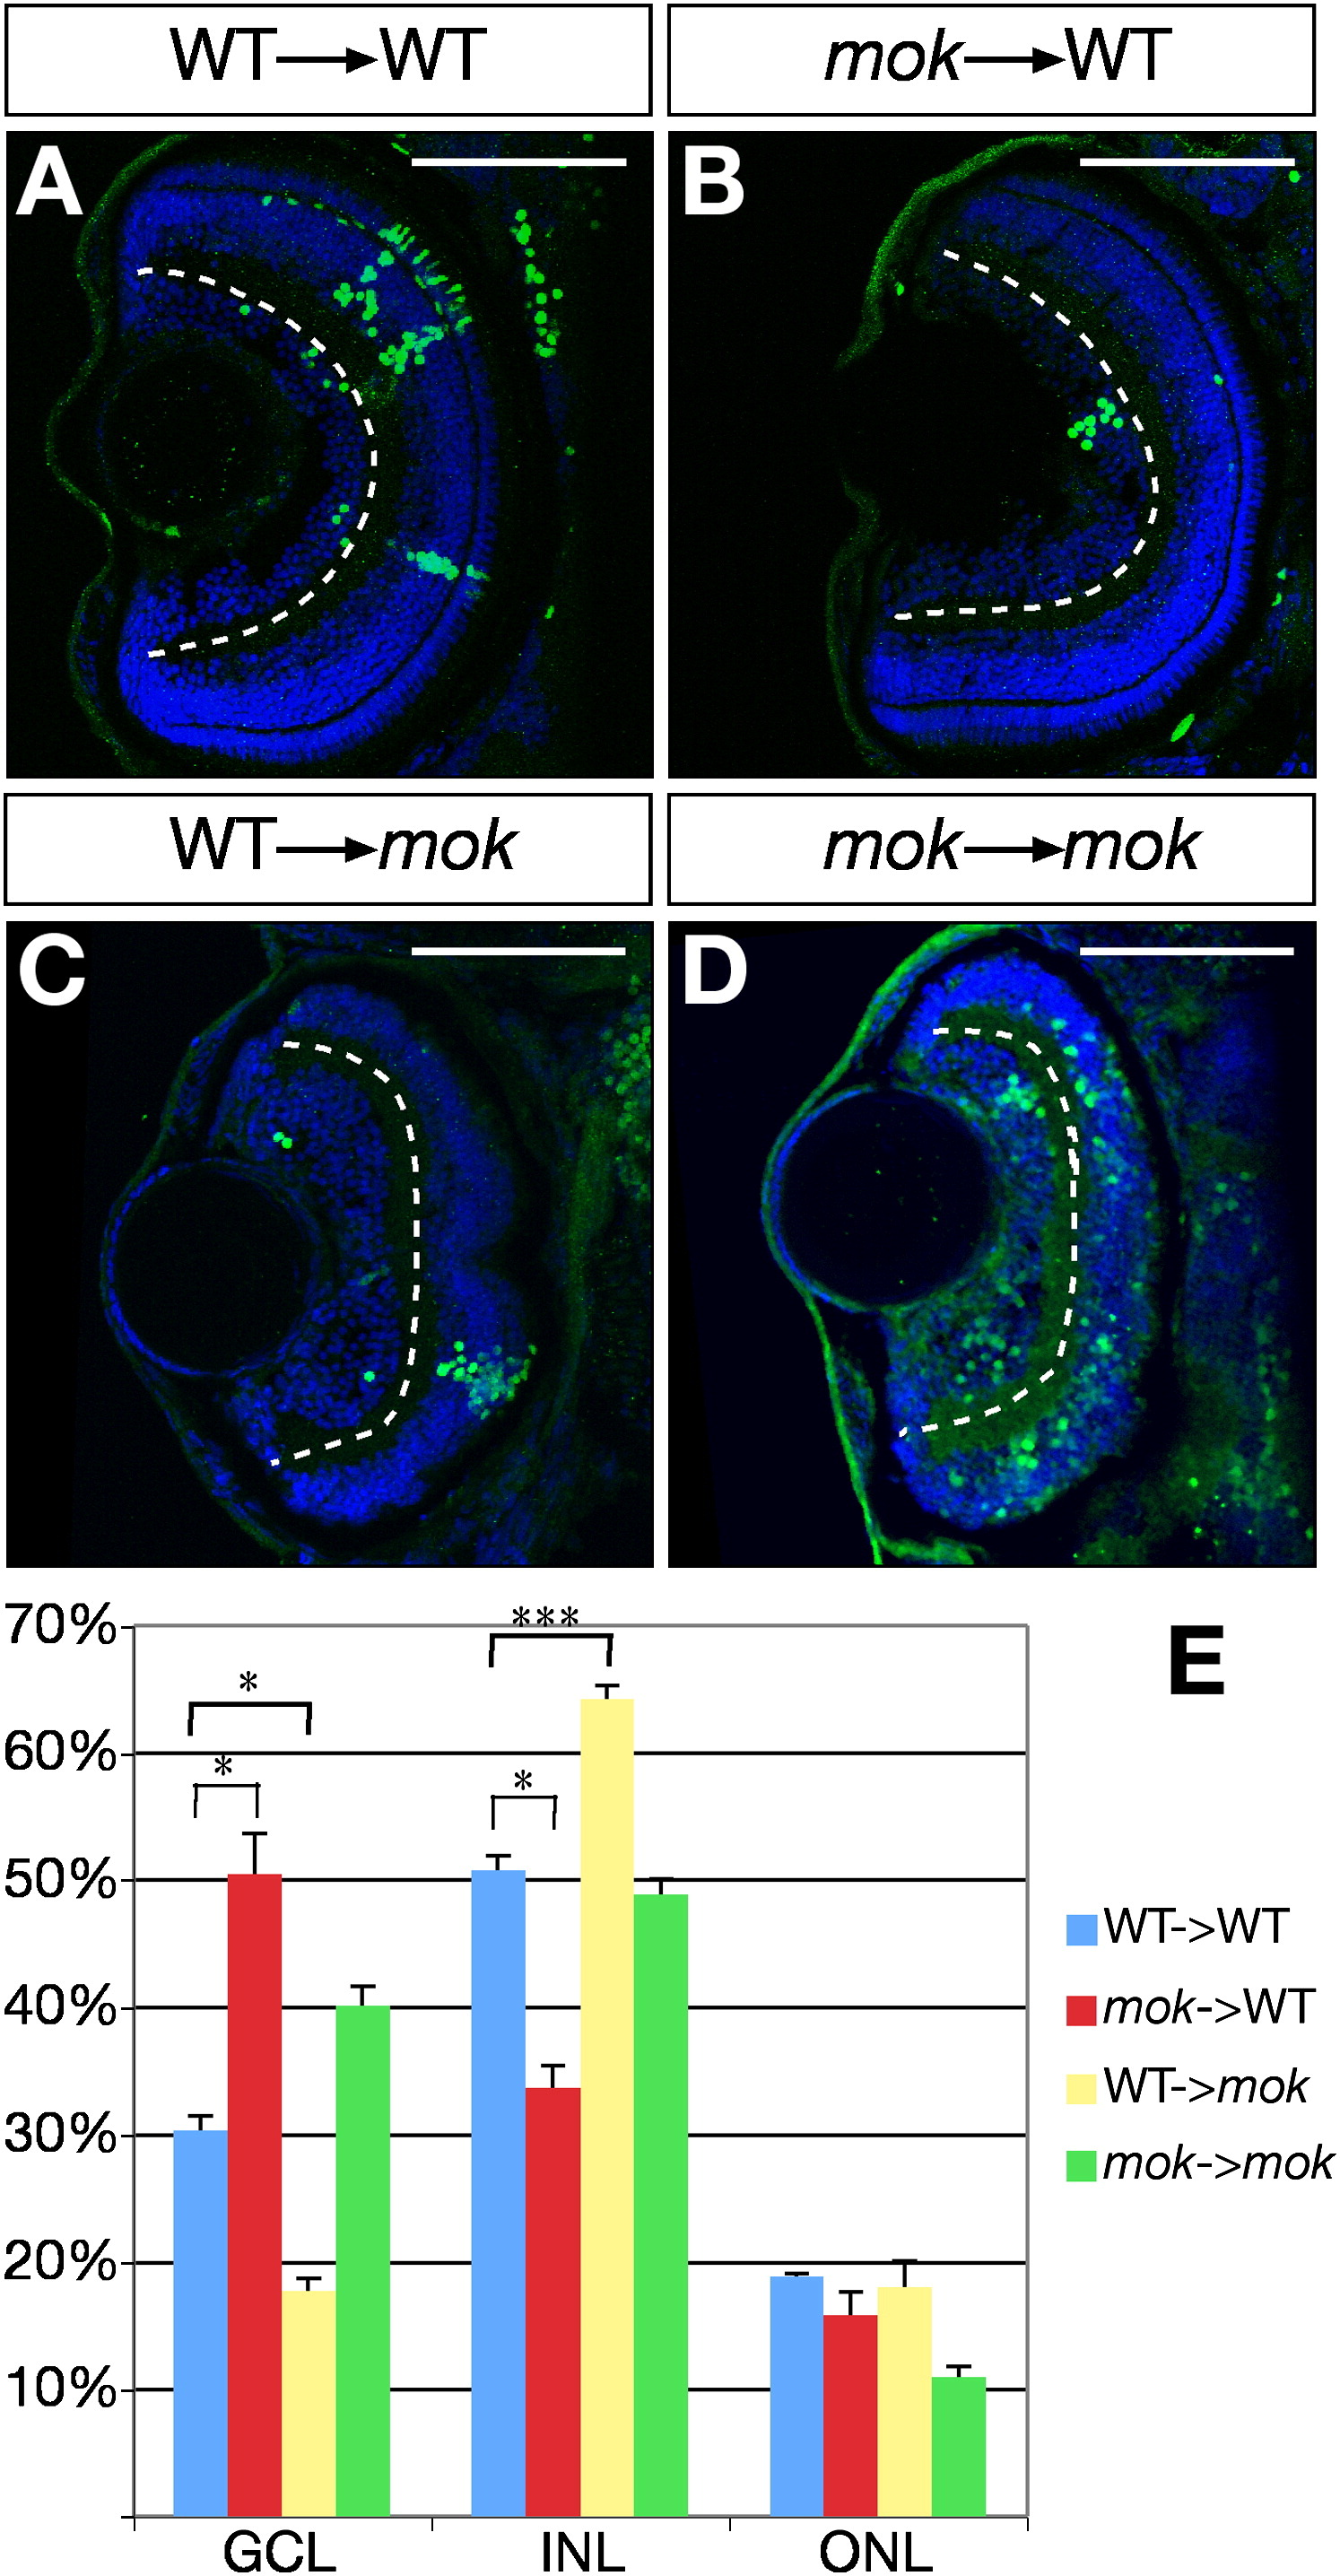
Fig. 3 Cell Transplantation Analysis Reveals that mok Acts Cell Autonomously
(A–D) Representative sections of 5 dpf chimeric retinas. The transplanted cells are clearly identified by the expression of H2A-GFP marker (green) in their nuclei. Cell transplantation shows that moks309 mutant clones in wild-type host retinas (B) have a higher propensity to generate neurons located in the GCL compared to control (A). Conversely, wild-type clones in moks309 host retinas preferentially generate INL neurons (C). moks309 mutant clones in moks309 host retinas are shown for comparison (D). Dashed lines indicate the outer limit of the GCL. Scale bars, 100 μm.
(E) Quantification of the transplantation results showing the distribution of clones in the three retinal nuclear layers. ***p < 0.001; *p < 0.01. Error bar indicates SEM.
Reprinted from Cell, 134(6), Del Bene, F., Wehman, A.M., Link, B.A., and Baier, H., Regulation of neurogenesis by interkinetic nuclear migration through an apical-basal notch gradient, 1055-1065, Copyright (2008) with permission from Elsevier. Full text @ Cell