
|
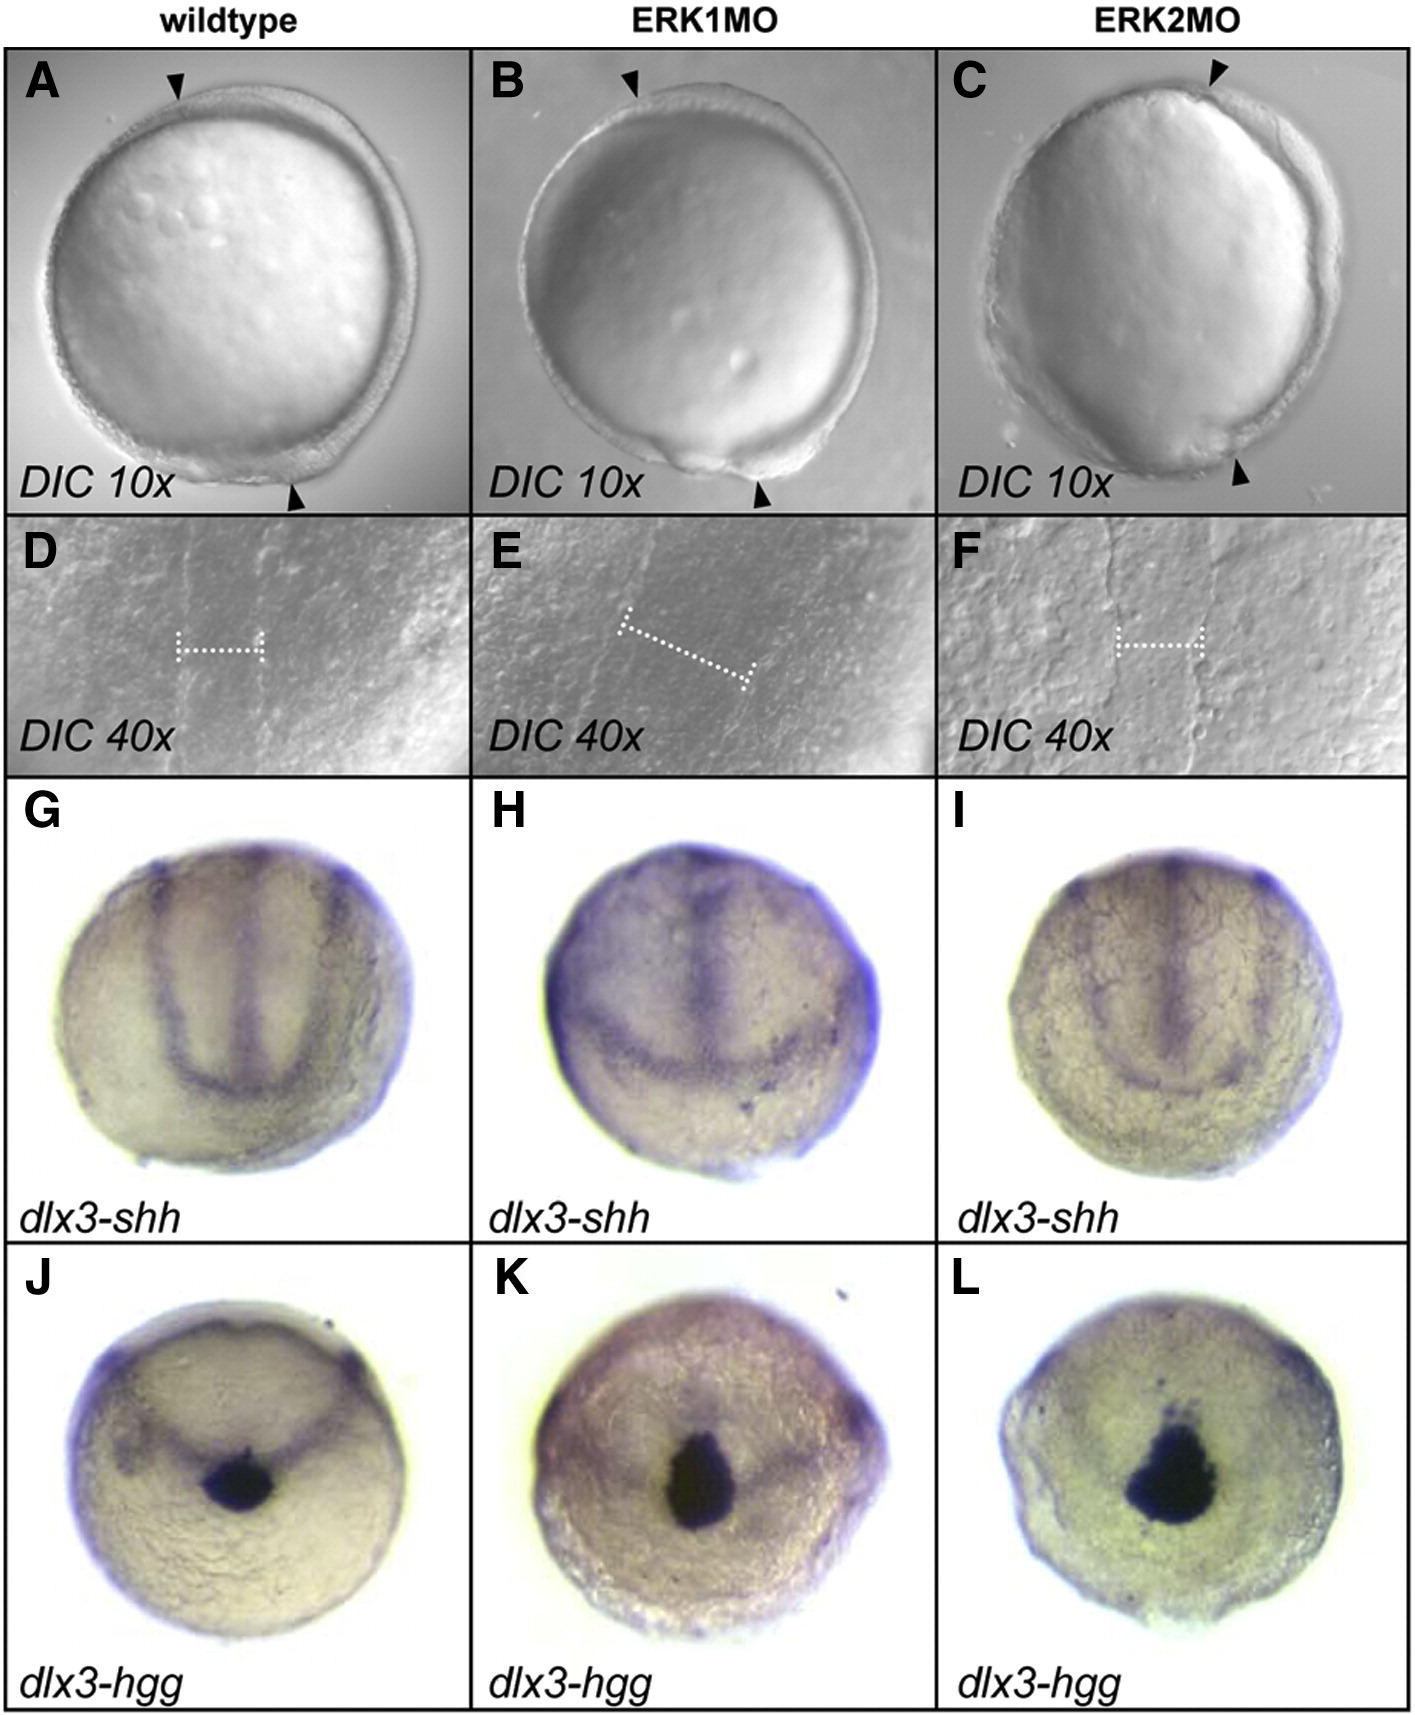
Fig. 2 Phenotypic characterization of ERK1 and ERK2 morphants in late-gastrulation and early segmentation indicates affected cell migration in CE movements. (A, D, G, J); wild type control embryos, (B, E, H, K); ERK1 knockdown embryos, injected with 0.2 mM ERK1MO, (C, F, I, L); ERK2 knockdown embryos, injected with 0.2 mM ERK2MO. (A–C); Live embryos at yolk plug closure (YPC) to tailbud (TB) stages, animal pole is up, dorsal to right in wild type, ERK1MO or ERK1MO injected embryos, The distance between the arrowheads resembles the length of the AP body axis (Zeiss EC Plan-Neofluar 10x/0.30 objective), or dorsal view (D–F), white spacer highlights the widening of the dorsal notochord (Zeiss Plan-Neofluar 40x/0.75 ∞/0.17 objective). (G–L); Combined in situ hybridization on 10-hpf old embryos with dlx3 (edge neural plate) with shh (midline) or with hgg1 (hatching gland) marker genes (anterior view, dorsal to top).
Reprinted from Developmental Biology, 319(2), Krens, S.F., He, S., Lamers, G.E., Meijer, A.H., Bakkers, J., Schmidt, T., Spaink, H.P., and Snaar-Jagalska, B.E., Distinct functions for ERK1 and ERK2 in cell migration processes during zebrafish gastrulation, 370-383, Copyright (2008) with permission from Elsevier. Full text @ Dev. Biol.