
|
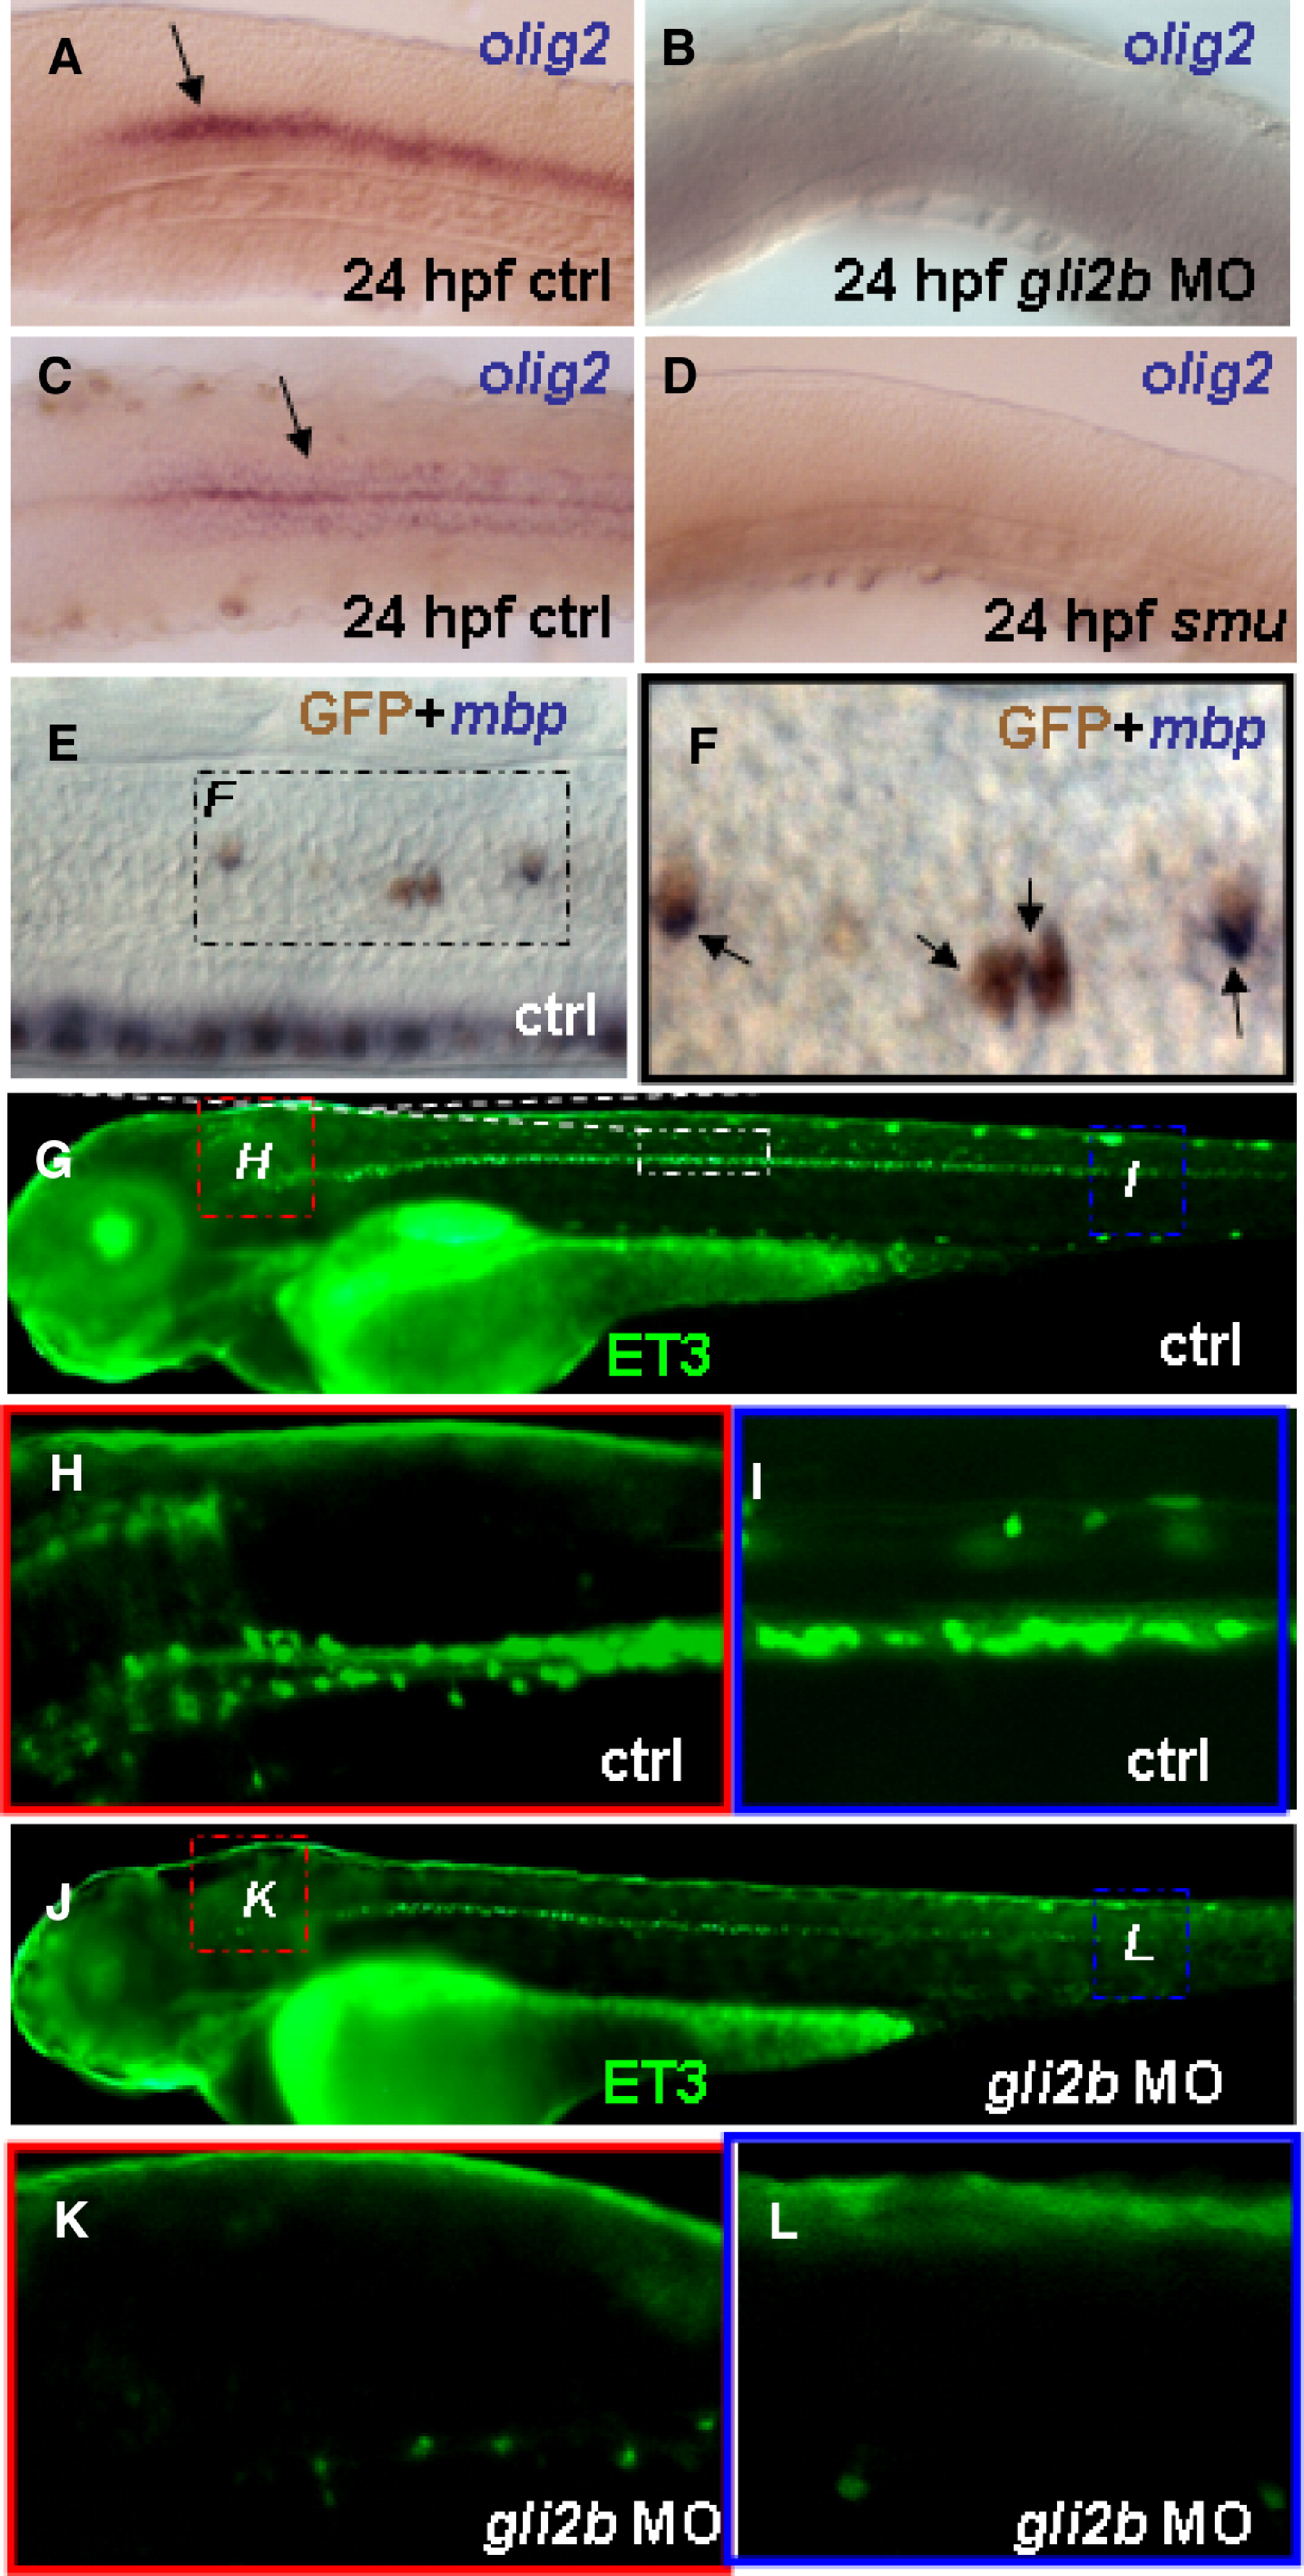
Fig. 4 Gli2b and Olig2. olig2 expression in the hindbrain in 24 hpf control embryo in lateral view (A, black arrow), 24 hpf Gli2b morphant in lateral view (B), 24 hpf control embryo in dorsal view (C, black arrow) and 24 hpf smu mutant in lateral view (D). In the ET3 line GFP maps oligodendrocytes as shown by double staining of anti-GFP antibody and antisense mbp probes (E). Blow-up (F) of the black frame in panel E reveals the mbp mRNA (blue, arrows) in GFP expressing cells (brown). (G) 4 dpf control ET3 line and ET3 Gli2b morphants (J). Blow-up of the hindbrain (H) and posterior trunk (I) in 4 dpf ET3 controls. Blow-up of the hindbrain (K) and posterior trunk (L) in ET3-Gli2b morphant.
Reprinted from Molecular and cellular neurosciences, 37(2), Ke, Z., Kondrichin, I., Gong, Z., and Korzh, V., Combined activity of the two Gli2 genes of zebrafish play a major role in Hedgehog signaling during zebrafish neurodevelopment, 388-401, Copyright (2008) with permission from Elsevier. Full text @ Mol. Cell Neurosci.