
|
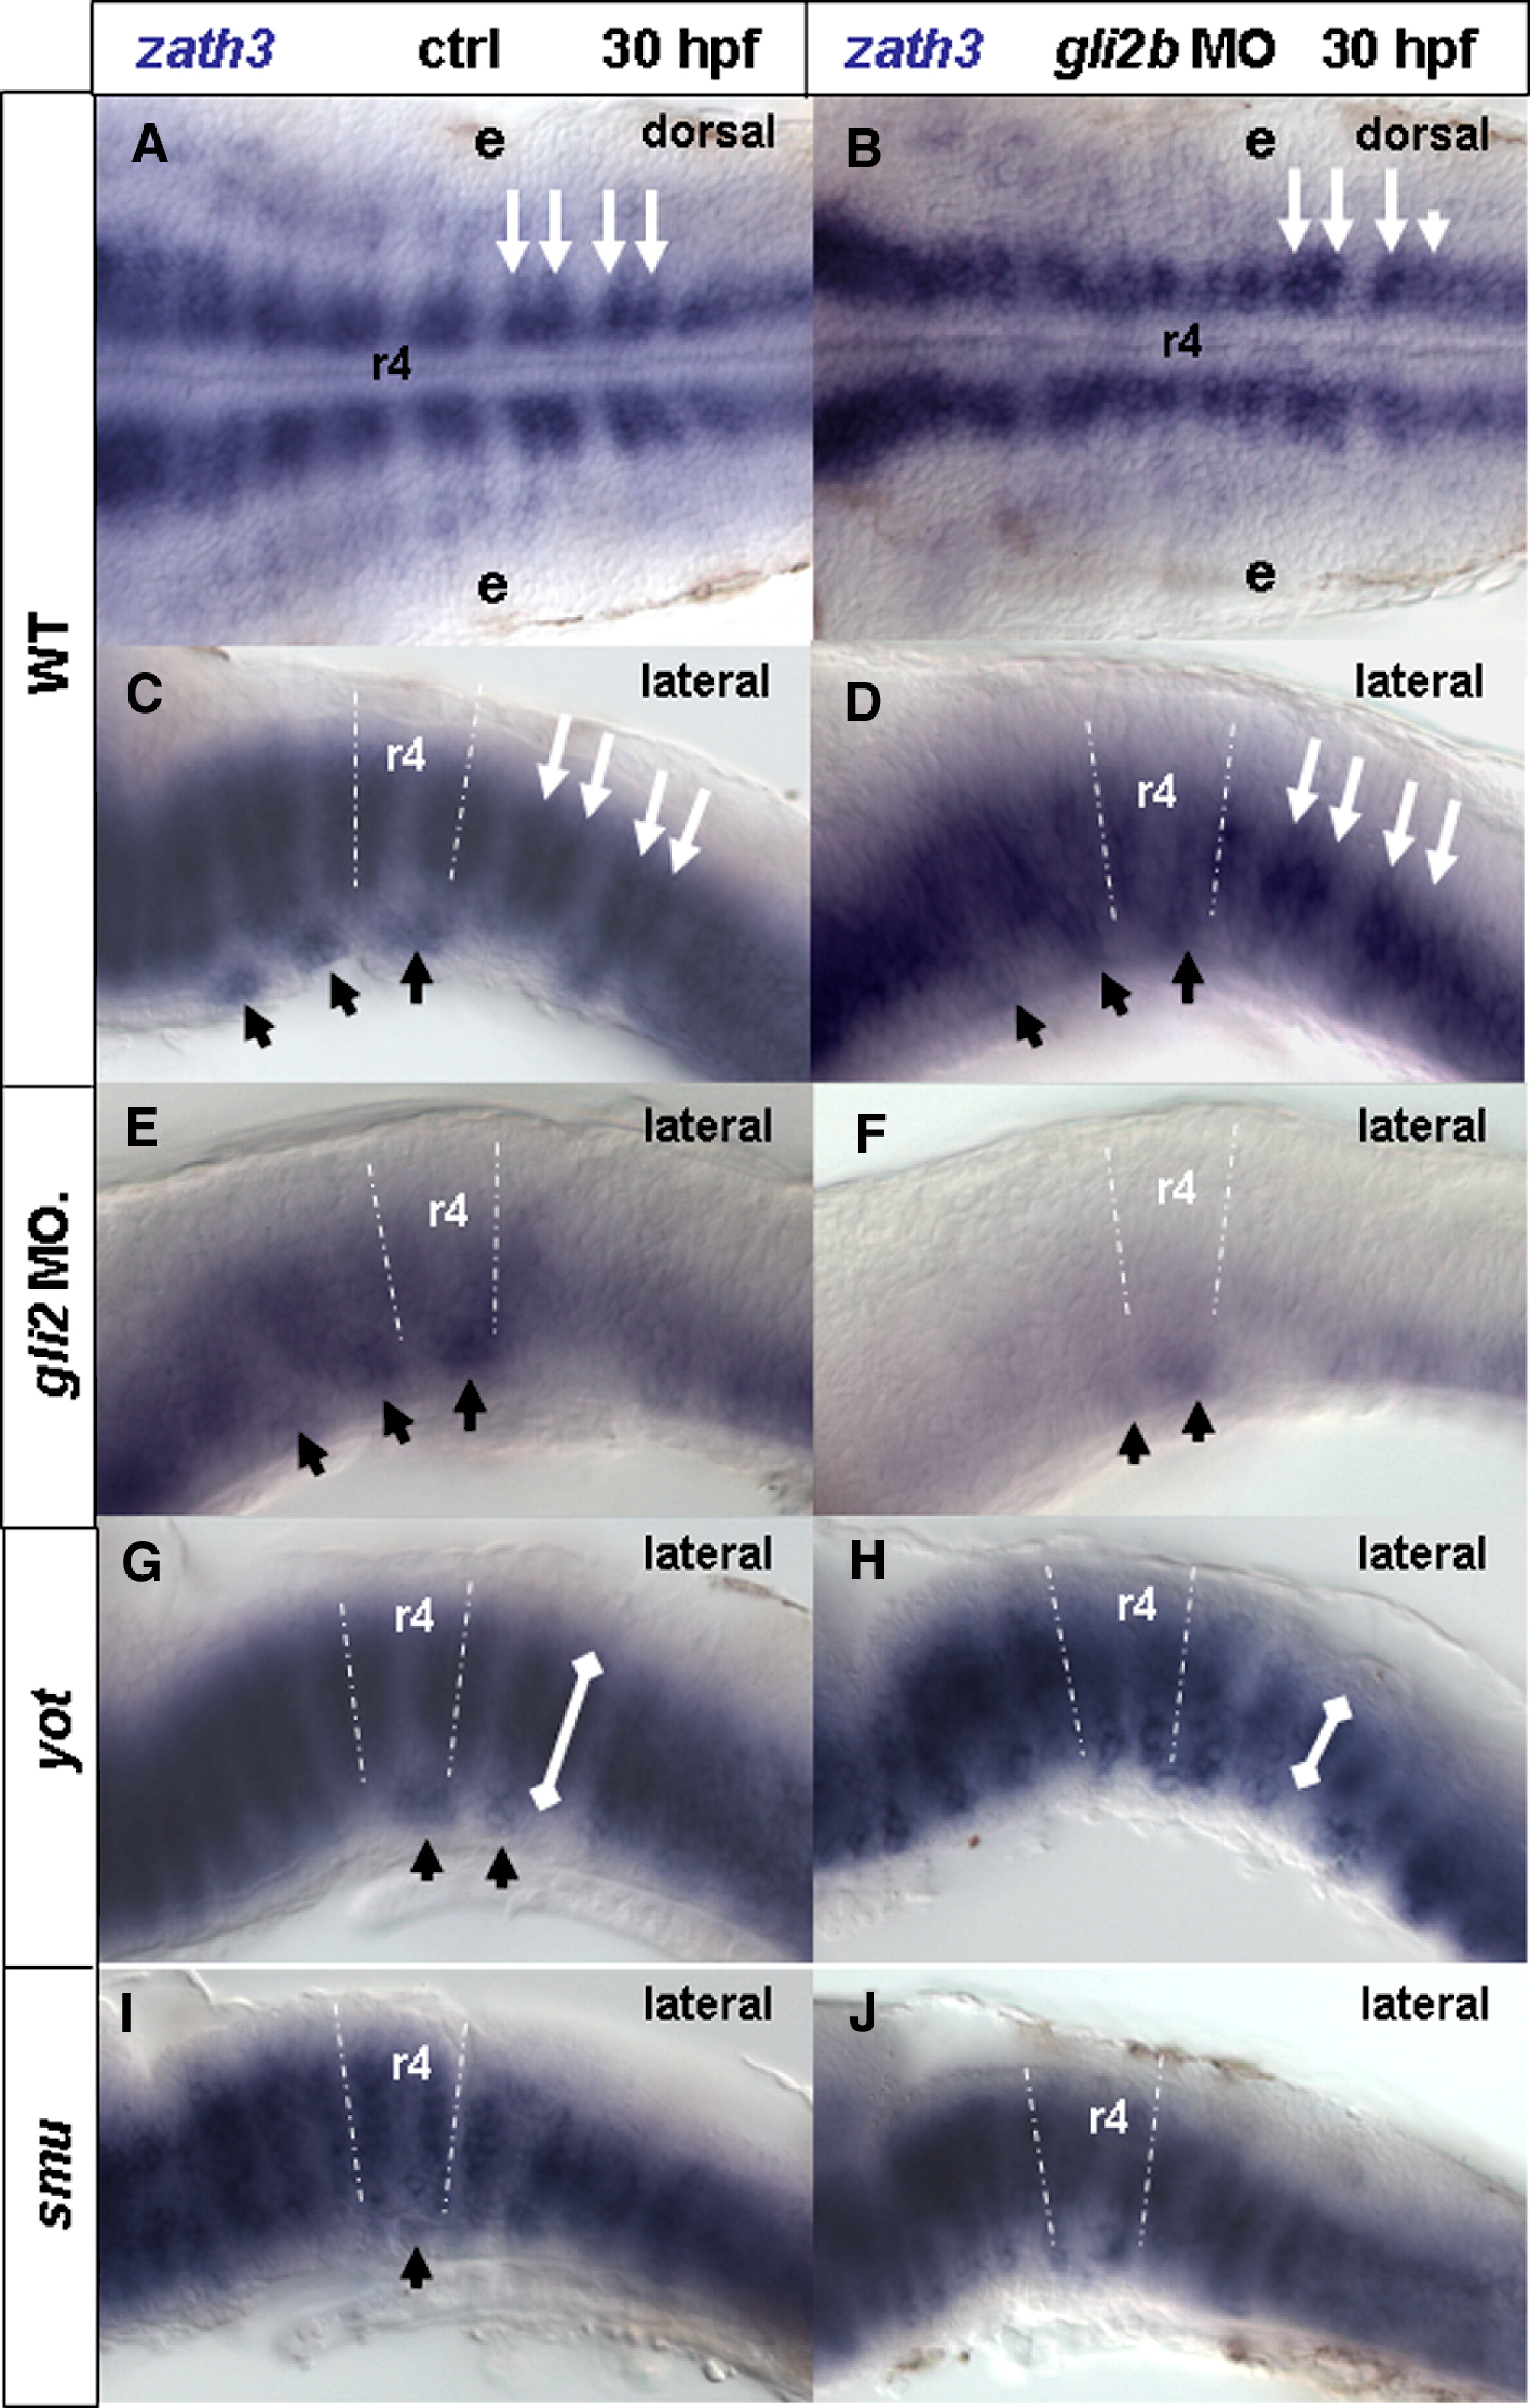
Fig. 2 Gli2a and Gli2b regulate expression of zath3. zath3 expression in the hindbrain in 30 hpf in control (A, C, E, G, I) or gli2b morphants (B, D, F, H, J). White broken lines indicate rhombomere 4 (r4). (A, C) Control; (B, D) Gli2b morphant; (E) Gli2a morphant; (F) Gli2a/Gli2b morphant; (G) yot-/- mutant; (H) yot-/- mutant/Gli2b morphant; (I) smu-/- mutant; (J) smu-/- mutant/Gli2b morphant. Black arrows indicate ventral zath3-positive clusters of the hindbrain. White arrows (A–D) indicate D–V clusters. White lines (G, H) illustrate the D-V extent of the cluster. Abbreviations: e, ear; r4, rhombomere 4.
Reprinted from Molecular and cellular neurosciences, 37(2), Ke, Z., Kondrichin, I., Gong, Z., and Korzh, V., Combined activity of the two Gli2 genes of zebrafish play a major role in Hedgehog signaling during zebrafish neurodevelopment, 388-401, Copyright (2008) with permission from Elsevier. Full text @ Mol. Cell Neurosci.