
|
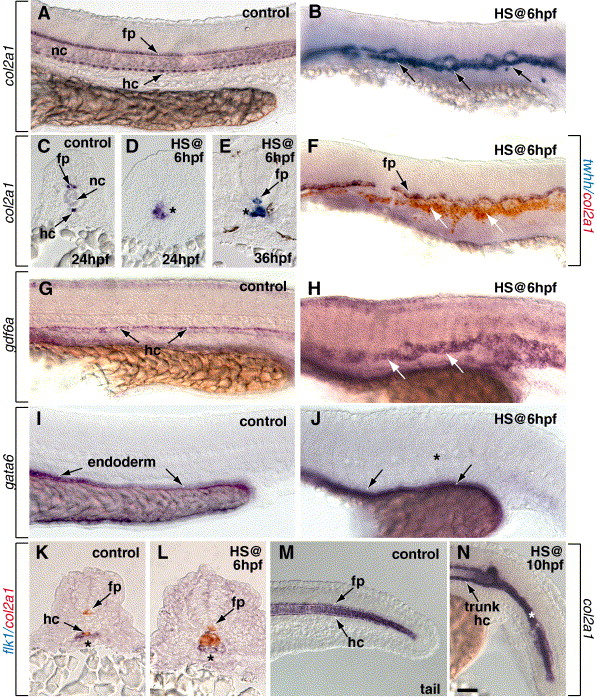
Fig. 3 Activation of Notch signaling at 6 hpf promotes formation of trunk hypochord but not floor plate. All embryos except panel E are 24 hpf. (A, B, F–J, M, N) Side views with anterior to the left. (C–E, K, L) Transverse sections. (A–E) Embryos were probed for col2a1 expression, which marks floor plate (fp) and hypochord (hc) cells. (A) Control embryo showing normal trunk floor plate and hypochord. The notochord (nc) is located between the floor plate and hypochord. (B) Heat shock induction of NICD expression at 6 hpf expanded col2a1 expression (arrows). Note that the notochord appears reduced. (C) Control embryo showing normal location of col2a1-expressing floor plate and hypochord in transverse section. (D) After NICD induction at 6 hpf, col2a1 expression (asterisk) was expanded immediately ventral to the spinal cord, normally the position of the notochord. (E) At 36 hpf, col2a1-expressing cells replaced notochord (asterisk) following NICD induction at shield stage. (F) NICD induction at 6 hpf did not expand floor plate, marked by twhh expression, (black arrow), while excess col2a1-expressing cells formed below floor plate (white arrows). (G) Control embryo showing normal pattern of gdf6a-expressing hypochord cells (arrows). (H) gdf6a expression was expanded after NICD induction at 6 hpf. (I) Normal expression pattern of gata6 expression in trunk endoderm of control embryo (arrows). (J) gata6 expression appeared normal after NICD induction at 6 hpf. Note the absence of gata6 expression in the midline region (asterisk). (K, L) flk1 marks aorta precursor cells. Hypochord was not labeled by flk1 in either control embryos (K) or embryos that expressed NICD at 6 hpf (L). (M) Tail region of a control embryo showing normal col2a1 expression in the floor plate and hypochord and transient expression in the tail notochord. (N) Heat shock induction of NICD at 10 hpf did not expand trunk hypochord (arrow), but tail col2a1 expression was expanded and notochord appeared reduced (asterisk). Scale bar: 40 μm for panels A, B, F–J, M, N; 20 μm for panels C–E, K, L.
Reprinted from Developmental Biology, 298(2), Latimer, A.J., and Appel, B., Notch signaling regulates midline cell specification and proliferation in zebrafish, 392-402, Copyright (2006) with permission from Elsevier. Full text @ Dev. Biol.