
|
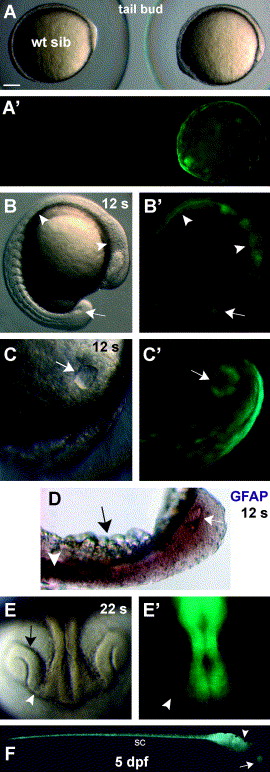
Fig. 2 Transgene expression during early development of live Tg(gfap:GFP) embryos. In this and all subsequent figures, dorsal is up and anterior to the right, unless otherwise noted. (A, A′) Two F1 siblings from the same clutch at the tail bud-stage (∼10 hpf). The wild-type sibling (left; wt sib; anterior to the left) did not express GFP. The transgenic sibling (right) was GFP-positive. (B, B′) A lateral view of an embryo at the 12-somite-stage (12 s; ∼15 hpf) shows GFP in the brain, spinal cord (arrowheads) and also in Kupffer’s vesicle (arrow) in the leading edge of the tail bud. (C, C′) Kupffer’s vesicle at higher magnification (arrow) at the 12-somite-stage. (D) Whole-mount in situ hybridization of a fixed 12-somite-stage embryo demonstrates labeling of Kupffer’s vesicle (arrow) and the developing spinal cord (arrowhead) by an antisense gfap RNA probe (dark purple). The yolk was removed for imaging purposes (black arrow). (E, E′) A 22-somite-stage (22 s;∼20 hpf) embryo strongly expresses GFP in the brain and moderately along the optic stalk (arrowhead) towards the retinal primordium (arrow), which did not express GFP. (F) In a larval fish at 5 dpf the lens (arrow), brain (arrowhead) and spinal cord (sc) strongly express GFP. Scale bar: 150 μm (A); 100 μm (B); 25 μm (C); 45 μm (D); 50 μm (E); or 300 μm (F).
Reprinted from Gene expression patterns : GEP, 6(8), Bernardos, R.L., and Raymond, P.A., GFAP transgenic zebrafish, 1007-1013, Copyright (2006) with permission from Elsevier. Full text @ Gene Expr. Patterns