
|
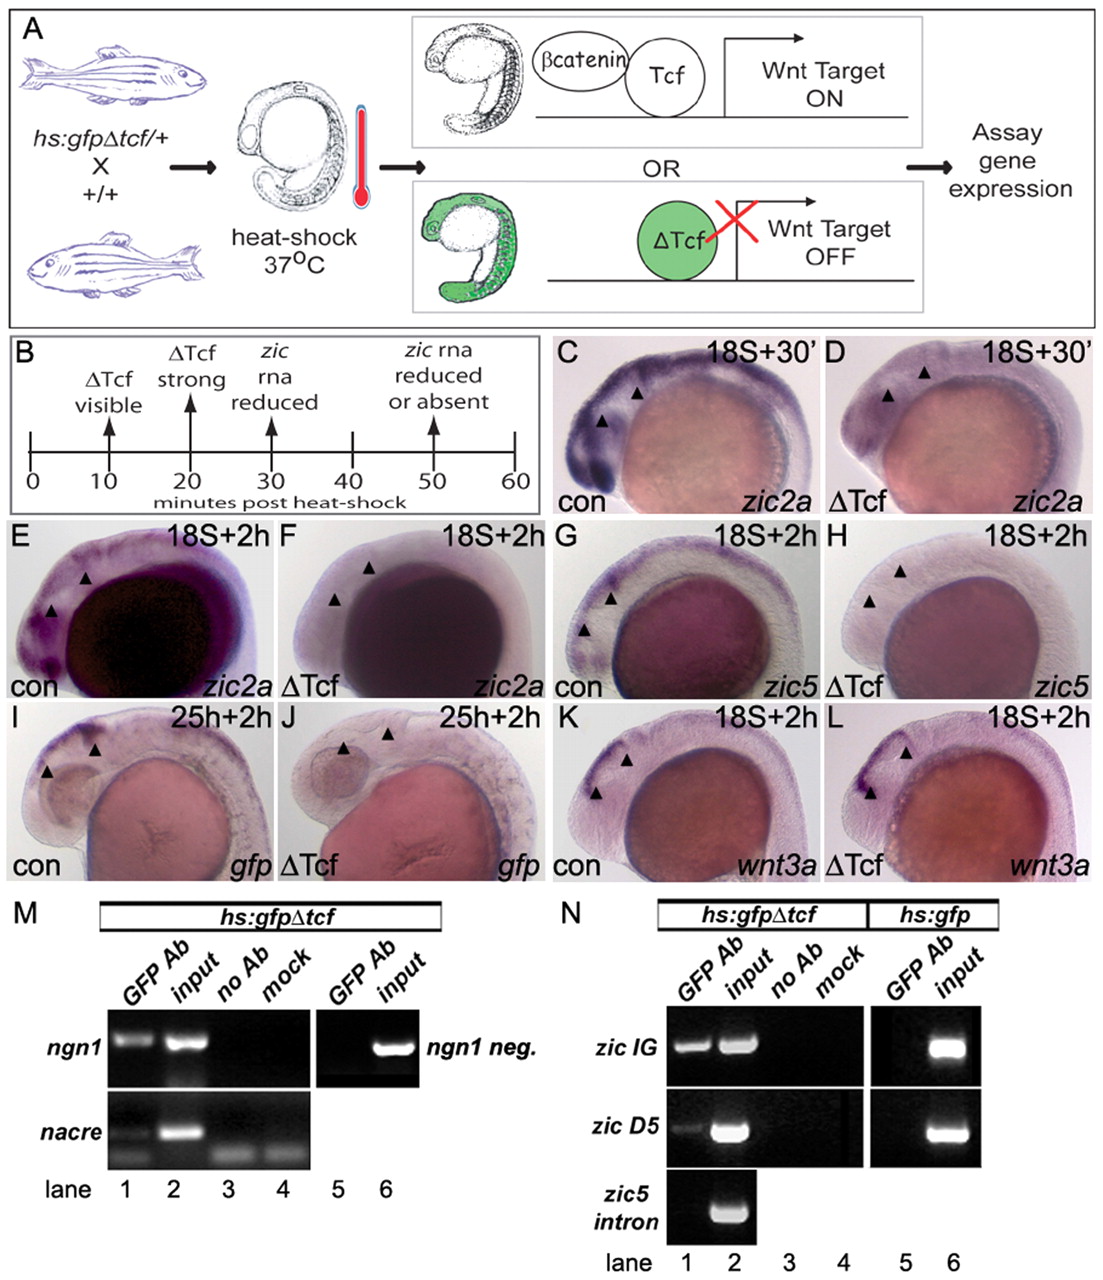
Fig. 4 Tcf/Lefs are required for zic gene expression. (A) The method used to disrupt Tcf/Lef signaling at controlled times. (B) Temporal correlation between GfpΔTcf induction (by fluorescence) and zic2a RNA (by ISH). (C-L) Representative embryos after ISH. Stage of heat-shock and recovery time are indicated at upper right. Zic2a expression is normal in ΔTcf-negative heat-shocked controls (C,E), and reduced or absent in ΔTcf-positive siblings (D,F). Zic5 expression was normal in ΔTcf-negative (G) embryos, and absent in ΔTcf-positive embryos (H). Zic2aD5:gfp expression was normal in ΔTcf-negative embryos (I) and absent in ΔTcf-positive embryos (J). Wnt3a expression was normal in heat-shocked controls (K) and in ΔTcf-positive siblings (L). All views are lateral, anterior to the left. Arrowheads mark anterior and posterior tectal borders. (M,N) Gfp ChIP analysis of heat-shocked Tg(hs:gfpΔtcf) and Tg(hs:gfp) embryos. Genotype of embryos and PCR templates are shown above, as follows: GFP Ab, chromatin after anti-Gfp IP; input, total chromatin before IP; no Ab, no-antibody ChIP; mock, no chromatin. Regions amplified are labeled next to the corresponding bands. (M) Promoters of known Wnt targets, ngn1 and nacre. An upstream region of ngn1, lacking functional Tcf/Lef-binding sites (lane 5). (N) IG and D5 regions of zic2a-zic5 and zic5 intron.