
|
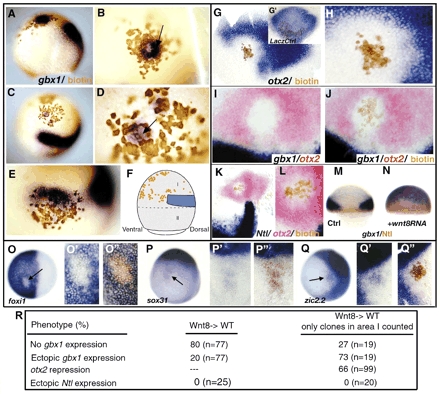
Fig. 6 Wnt8 can induce gbx1 and repress otx2. (A-E) Embryos containing cells derived from embryos injected with a lineage tracer (brown) and wnt8 RNA (400 pg) stained for gbx1 expression. (A) Lateral view and (B) close-up of the transplanted cells seen in A; the arrow indicates gbx1 expression in the transplanted cells. (C) Lateral animal pole view of a transplanted embryo and (D) close-up of the transplanted cells. gbx1 is induced in the host tissue but also in the transplanted cells (arrow). (E) Strong induction of gbx1 expression in the host embryo at the AP level of the endogenous gbx1 domain. (F) Summary of all transplanted cells clones that induced gbx1 expression. The embryo can be subdivided into a wnt8-responsive part (I) and non-responsive part (II). (G) wnt8-overexpressing cells (brown) transplanted into wild-type embryos and stained for otx2. (H) Close-up of the transplanted cells. otx2 is repressed in the transplanted cells and in the host cells. (G′) Control lacZ-overexpressing cells (brown) transplanted in wild-type embryos and stained for otx2 expression. No repression in the transplanted cells and host cells is observed. (I) wnt8-overexpressing cells transplanted into wild-type embryos and stained for otx2 (red) and gbx1 expression (blue); (J) close-up of the transplanted cell after biotin staining (brown). No ectopic gbx1 expression is seen in the transplanted area where otx2 is repressed. (K) wnt8-overexpressing cells (brown) transplanted into wild-type embryos and stained for otx2 (red) and ntl expression (blue); (L) close-up of the transplanted cells. No ectopic ntl expression is seen in the transplanted area where otx2 is repressed. (M) Control embryo at 60% stained for gbx1 (blue) and Ntl protein (brown). (N) Overexpression of wnt8 induces ectopic gbx1 throughout the epiblast and Ntl expression is expanded from three or four rows of cells. (O-Q′′) wnt8-expressing clones correlate with loss of non-neural, and gain of neural marker induction. (O-O′′) foxi1 expression; (O) animal pole view. (P-P′′) sox31 expression, (Q-Q′′) zic2.2 expression. (P,Q) Lateral views. Close-up of the transplanted cells (O′,P′,Q′) before biotin staining and (O′′,P′′,Q′′) after biotin staining. foxi1 repression occurs in the transplanted cells and sox31 and zic2.2 are induced. (R) Observed ectopic induction of gbx1, repression of otx2 and induction of Ntl when wnt8-overexpressing cells were transplanted into wild-type host embryos. In the last column, only cell clones within the endogenous gbx1 domain and the animal pole, the area I (see Fig. 6F), are scored. n, number of transplanted embryos.