|
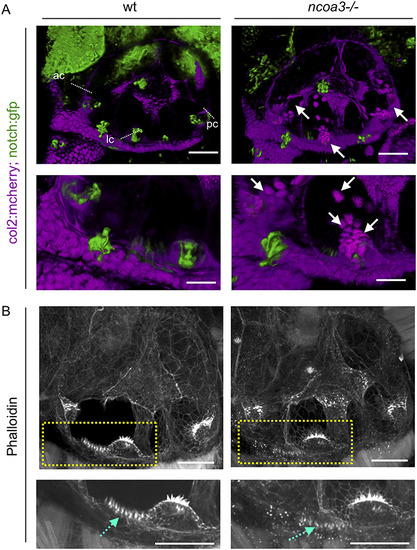
Abnormal cartilage behaviour and macula hair distribution in ears of ncoa3−/− A) 3D renders from confocal images of wt and ncoa3−/− carrying Tg(col2:mcherry, notch:gfp) to show cartilage and cristae, respectively. Arrows indicate abnormal cartilage cell behaviour (cell exostosis). (ac = anterior crista, lc = lateral crista, pc = posterior crista). Scale bars = 50 μm. Regions of anterior crista and macula were zoomed in. Scale bars = 20 μm. B) Phalloidin staining and confocal imaging to show the distribution of hair cells. Yellow dashed box to show zoomed in region. Abnormal distribution of hair cells was observed in the macula (dashed cyan arrows). Scale bars = 50 μm, zoomed in region = 20 μm.
|