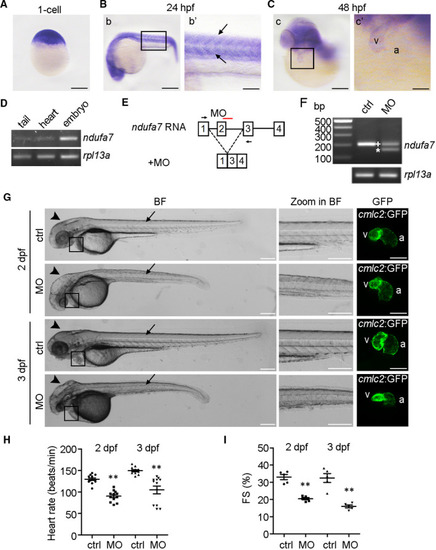
Knockdown of ndufa7 results in cardiac defect in developing zebrafish embryos. (A‐C) Representative images of whole‐mount in situ hybridization using the ndufa7 riboprobe were showed. The experiments were performed in triplicate, with 20 embryos per developmental stage. (A) Zebrafish ndufa7 transcript is broadly expressed at 1‐cell stage. Scale bar, 250 μm. (B) At 24 hpf, ndufa7 is expressed in the somite (box in b, and arrow in b’). Scale bar, 250 μm in b, 100 μm in b’. (C) By 48 hpf, ndufa7 is enriched in the heart (box in c), v represents ventricle, and a represents atrium. Scale bar, 250 μm in c, 100 μm in c’. (D) RT‐PCR of ndufa7 and rpl13a RNA isolated from 2 dpf cmlc2::GFP zebrafish whole embryo, tail and heart. (E) The ndufa7 splice morpholino target site and the aberrant transcript. (F) RT‐PCR amplification of RNA from control MO and ndufa7 MO‐injected zebrafish showing altered splicing of ndufa7 with either the integration of exon 2 (+) or the partial skipping of exon 2 (*). (G) Morphological defects observed in ndufa7 morphants (MO) or controls (ctrl) at 2 dpf and 3 dpf. Arrows and arrowheads showed the defects in somites and head, respectively. The fluorescent image demonstrated heart phenotype from the enlarged box region. Scale bar, 300 μm in bright field (BF) and zoom in BF, 150 μm in GFP field. V represents ventricle, and a represents atrium. The experiments were performed in triplicate, processing 40 embryos per condition. (H) WT embryos were injected with MOs at 1‐cell stage, and heart rate was counted via a recorded video captured with the aid of a microscope. Statistical test: Student's t test. **P < .01 compared with controls. n = 12 measurements per condition. (I) Fractional shortening (FS) of the ventricular chamber in control and ndufa7 morphants was measured at the indicated developmental stages. Statistical test: Student's t test. *P < .05 compared with controls. n = 5 measurements per condition
|
