
Fig. 1
- ID
- ZDB-FIG-191230-1319
- Publication
- Mazzolini et al., 2019 - Gene expression profiling reveals a conserved microglia signature in larval zebrafish
- Other Figures
- All Figure Page
- Back to All Figure Page
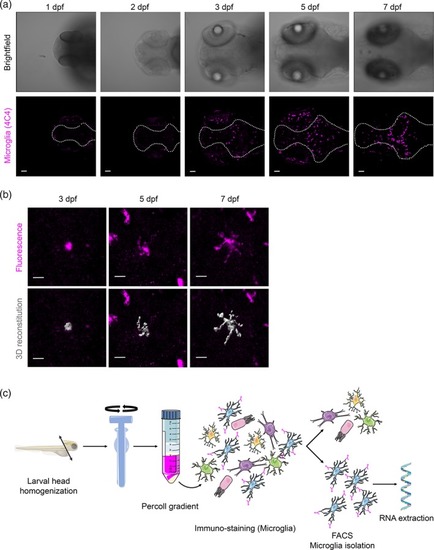
Development of the microglia population in larval zebrafish. (a) Representative confocal images are shown to illustrate zebrafish larval head development from 1 to 7 days postfertilization (dpf) and microglial cell distribution throughout the developing brain. Upper panels correspond to a brightfield transmission image and lower panels represent the maximum intensity projection of 4C4+ microglia (magenta) at each developmental stage. Microglia start colonizing the brain (dotted line) at 3 dpf whereas signal can be detected in the retina from 1 dpf onwards. Scale bar represents 50 μm. (b) Upper panels show 4C4 antibody immunohistochemistry, lower panels show segmented images of microglia morphology at 3, 5, and 7 dpf using the Imaris surface tool. Microglia morphology changes from amoeboid (1 dpf) to ramified (7 dpf) with an intermediate feature at 5 dpf. Scale bar represents 10 μm. (c) Schematic representation of the protocol used to isolate 4C4+ microglia from larval zebrafish brains at 3, 5, and 7 dpf. All images represent maximum intensity projections of confocal stacks. Images were captured using a Zeiss LSM710 confocal microscope with a 20×/NA 0.8 objective [Color figure can be viewed at |
| Antibody: | |
|---|---|
| Fish: | |
| Anatomical Terms: | |
| Stage Range: | Prim-5 to Days 7-13 |