
Fig. 6
- ID
- ZDB-FIG-191118-6
- Publication
- Ando et al., 2019 - Peri-arterial specification of vascular mural cells from naïve mesenchyme requires Notch signaling
- Other Figures
- All Figure Page
- Back to All Figure Page
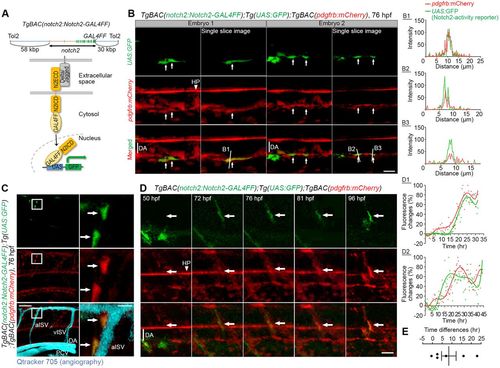
Notch activation in pdgfrbhigh MCs. (A) Schematic structure of the BAC clone (CH211-39M8) which was used to generate TgBAC(notch2:Notch2-GAL4FF) for visualizing Notch2-activated cells. A cDNA encoding GAL4FF was inserted at the C terminus of the notch2 gene. Notch2 intracellular region (N2ICD) fused with GAL4FF is proteolytically released and translocated to the nucleus upon Notch2 activation, therefore, Notch2 activated cells can be monitored by the expression of proteins such as GFP driven by the UAS/GAL4FF system. (B) Confocal images of the DA in TgBAC(notch2:Notch2-GAL4FF);Tg(UAS:GFP);TgBAC(pdgfrb:mCherry) larvae at 76 hpf. Left, stack images. Right, single slice images from stack images on the left. Arrows indicate pdgfrbhigh MCs beneath the DA with Notch2 activation. The fluorescence intensity profile of pdgfrb:mCherry (red line) and UAS:GFP (green line) along the line in the single slice images (B1-B3) are shown on the right, indicating the colocalization of mCherry and GFP expression. The x-axes show distance from the beginning of the line. (C) Confocal stack images of the trunk vessels of TgBAC(notch2:Notch2-GAL4FF);Tg(UAS:GFP);TgBAC(pdgfrb:mCherry) larvae at 76 hpf. Vascular structure was visualized by injection of Qtracker 705 vascular labels (aqua) into the circulation. Boxed regions depicting pdgfrbhigh MCs in aISV are enlarged to the right. Arrows indicate the Notch2-activated pdgfrbhigh MCs. Notch2-activity-positive MCs in ISVs/DA at 74 hpf were seen in 31.6% (12/38) of embryos shown. (D) Time-lapse imaging of the trunk region (ISV) of TgBAC(notch2:Notch2-GAL4FF);Tg(UAS:GFP);TgBAC(pdgfrb:mCherry) embryo at the indicated time points. Note that Notch2 activation precedes the increase of pdgfrb expression. GFP signal was absent at 50 hpf, but induced in pdgfrblow cells after 72 hpf. Subsequently, pdgfrb:mCherry expression was increased in Notch2-activated pdgfrblow cells (arrows). Representative fluorescence changes (% of the peak value of pdgfrb- or Notch2-activity reporter fluorescence) are shown on the right (D1, ISV-MC; D2, DA-MC). Red dots, pdgfrbreporter. Green dots, Notch2-activity reporter. Polynomial fitting curves for the pdgfrb (red line) and Notch2-activity reporter (green line) were assigned using the polyfit function in MATLAB with the degree of 7. The x-axes show the relative time. (E) Comparison of the time showing the highest value of Notch2 activity and the pdgfrb reporter in fitting curve. The data are mean±s.e.m. (n=6). Note that the time showing the highest GFP fluorescence preceded that of mCherry fluorescence by more than 8 h on average, indicating that Notch2 is activated before the onset of pdgfrb increase. HP, hypochord; N2ECD, Notch2 extracellular region; PCV, posterior cardinal vein. Scale bars: 20 µm in B,D: 50 µm in C: 10 µm in enlarged images in C. |
| Gene: | |
|---|---|
| Fish: | |
| Anatomical Terms: | |
| Stage Range: | Long-pec to Day 4 |