
Fig. 2
- ID
- ZDB-FIG-191021-2
- Publication
- Callahan et al., 2019 - Spinal V2b neurons reveal a role for ipsilateral inhibition in speed control
- Other Figures
- All Figure Page
- Back to All Figure Page
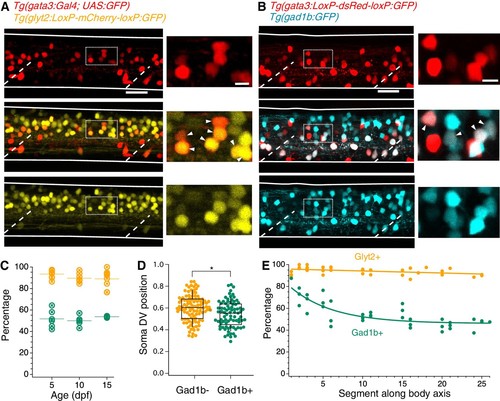
V2b neurons express the inhibitory neurotransmitter markers Glyt2 and Gad1b.( A) Lateral z-projection of a spinal cord hemisegment in a Tg(gata3:Gal4,UAS:GFP;glyt2:loxP-mCherry-loxP:GFP) (Gata3, top; Glyt2, bottom) double transgenic animal with composite image (middle). Dashed lines indicate muscle segments and solid lines indicate the spinal cord dorsal and ventral boundaries. Magnified inset, from dashed box, showing soma-level colocalization is shown to the right. Soma colocalization indicated with white arrowheads. Scale bar = 20 μm; inset 5 μm. ( B) Tg(gata3:loxP-DsRed-loxP:GFP;gad1b:GFP) (Gata3, top; Gad1b, bottom) and dual-color composite image (middle). Magnified inset, from dashed box, is shown to the right. Soma colocalization indicated with white arrowheads. Scale bar = 20 μm; inset 5 μm. ( C) Percentage of V2b neurons co-expressing Glyt2 (yellow) or Gad1b (green) is stable from ages 5–15 dpf, as measured in body segments 15–16. N = 6 animals at each time point, two clutches. ( D) V2b soma position for Gad+ and Gad- neurons differs slightly in the dorsoventral axis, *p<0.01 (p=1.87×10⁻³), N = 108 neurons in N = 6 animals from two clutches, Student’s t-test. ( E) Percentage of V2b neurons co-expressing Glyt2 or Gad1b along the rostrocaudal body axis, N = 6 animals from two clutches. |
| Genes: | |
|---|---|
| Fish: | |
| Anatomical Term: | |
| Stage: | Day 5 |