
Fig. 2
- ID
- ZDB-FIG-181012-7
- Publication
- Gawdzik et al., 2018 - sox9b is required in cardiomyocytes for cardiac morphogenesis and function
- Other Figures
- All Figure Page
- Back to All Figure Page
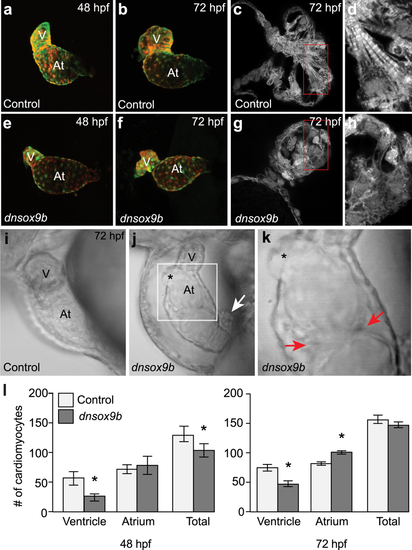
Cardiomyocyte-specific inhibition of sox9b function disrupts cardiac morphogenesis. Live control (a,b and i; Tg(myl7:Gal4VP16;UAS:tRFP)) zebrafish and zebrafish with cardiomyocyte-specific inhibition of sox9b function (e,f,j and k; Tg(myl7:Gal4VP16;UAS:dnsox9b-2A-tRFP)). (a,b,e,f) Embryos and larvae were anesthetized in Tricaine, treated with 20 mM 2,3-butanedione 2-monoxime to temporarily stop heartbeat, then mounted in low melting point agarose for confocal imaging. Ventral images were collected at 48 hpf (a,e) and 72 hpf (b,f). Control (Tg(myl7:Gal4VP16;UAS:tRFP)) embryos had looped hearts and exhibit time dependent chamber growth. Embryos and larvae with cardiomyocyte-specific inhibition of sox9b function (Tg(myl7:Gal4VP16;UAS:dnsox9b-2A-tRFP)) had small, compacted ventricles and unlooped heart chambers. (c,d,g,h) Super-resolution images of fixed control (c and d; Tg(myl7:Gal4VP16;UAS:tRFP)) and experimental larvae (g,h; Tg(myl7:Gal4VP16;UAS:dnsox9b-2A-tRFP)). Cardiomyocyte-specific inhibition of sox9b function disrupted the development of myofibrillar bundles and z-lines were notably absent. (i–k) Still images from Supplemental Movies. (k) Boxed area in j. Pericardial edema, holes in the heart (asterisks in j,k), and ectopic endothelial cushions (red arrows in k) were observed in larvae with cardiomyocyte-specific inhibition of sox9b function. Proepicardial cells were observed adjacent to the myocardium (white arrow in j). (l) Quantification of ventricular and atrial cardiomyocytes at 48 and 72 hpf. Cardiomyocyte-specific inhibition of sox9b function resulted in a decrease in ventricular cardiomyocytes and an increase in atrial cardiomyocytes. Light bars indicate control group and dark bars indicate the experimental group. Asterisks indicate significant differences between groups as determined by Student’s t-test (p < 0.05), n = 8–10 per group. Ventricle (V) and atrium (At) are abbreviated as indicated. |
| Fish: | |
|---|---|
| Observed In: | |
| Stage Range: | Long-pec to Protruding-mouth |