
Fig. S1
- ID
- ZDB-FIG-180827-19
- Publication
- Ferrero et al., 2018 - Embryonic Microglia Derive from Primitive Macrophages and Are Replaced by cmyb-Dependent Definitive Microglia in Zebrafish
- Other Figures
- All Figure Page
- Back to All Figure Page
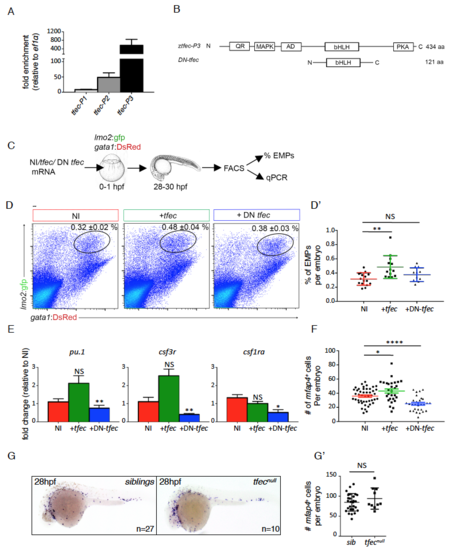
The transcription factor tfec controls EMP-derived hematopoiesis in vivo, related to Figure 2 (A) Quantification of tfec-P1 (NM_001030105.2), tfec-P2 (XM_005164535.2) or tfec P3 (XM_009299965.1) expression in FACS sorted EMPs from lmo2:GFP/gata1:DsRed embryos (27-28hpf). Fold enrichment for each tfec splice variant was calculated from expression levels in whole embryos (27-28hpf) (n=3). Error bars represent mean ± S.E.M. (B) Schematic diagram of translated proteins from tfec-P3 and a dominant-negative form of tfec (DN-tfec) mRNAs (bottom schematic). QR: glutamine rich domain, MAPK: consensus MAP kinase phosphorylation site, AD: transcriptional activation domain, bHLH: beta helix-loop-helix DNA binding domain, PKA: cAMP-dependant phosphorylation site, N: N terminal domain, C: C terminal domain, aa: amino acids. Schematics are not to scale. (C) Experimental outline to assess the consequence of tfec modulation on EMP biology in vivo. tfec mRNA (tfec), or DN-tfec were injected in Tg(lmo2:GFP; gata1:DsRed) embryos at the onecell stage. Controls are non-injected (NI). Lmo2+ gata1+ EMPs were quantified by flow cytometry and isolated for gene expression analyses. (D-D’) Representative FACS plots from NI controls (n=16), +tfec (n=13), +DN-tfec (n=12). Percentages in the top right hand corner represent mean ± S.E.M of EMPs within the gate. Comparative quantification is shown in the d’ panel. (E) QPCR data showing gene expression in FACS sorted EMPs for NI (n=4 for all, except csf1ra where n=3), +tfec (n=4 for all, except csf1ra where n=3) or DN-tfec (n=3 for all) conditions, where n represents the average of biological triplicates performed. Our results show that tfec loss-of-function strongly affects the expression of myeloid genes in EMPs. Error bars represent mean ± S.E.M. (F) Quantification of the number of mfap4+ cells (as determined by WISH) present within the tail region at 48hpf for NI (n=46), +tfec (n=28) or +DN-tfec (n=29) conditions. EMP-derived myelopoiesis is impaired in the loss of function condition. Error bars represent mean ± S.E.M. (G-G’) mfap4 WISH on siblings or tfecnull embryos at 28hpf. (g’) Quantification of mfap4+ primitive macrophages per embryo (one side). Statistical analysis was completed using an unpaired Student’s t-test, comparing NI to either +tfec or DN tfec injected. Data represents mean ± S.E.M. NS: no significance, *: p<0.05. **: p<0.01, ***: p<0.001. NI: non-injected, +tfec: hlztfec injected, +DN-tfec: dominant negative tfec injected. |
| Gene: | |
|---|---|
| Fish: | |
| Anatomical Term: | |
| Stage: | Prim-5 |