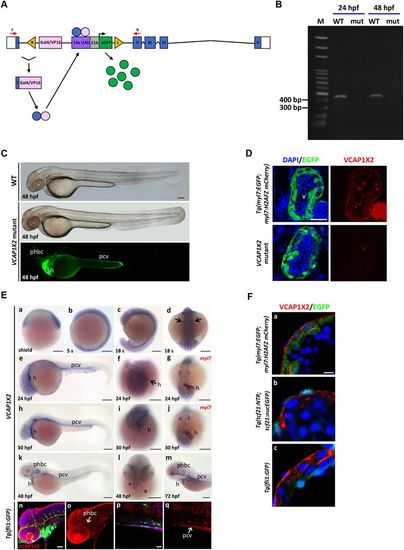
The gene trap transgenic zebrafish was characterized as a VCAP1X2 mutant. (A) A diagram of the VCAP1X2 gene trap mutant is shown. Blue boxes indicate exons I-V. White boxes indicate 5′ and 3′ UTRs. Red arrows indicate forward (F) and reverse (R) RT-PCR primers. Yellow triangles indicate 535-bp right Tol2 arm (R) or 517-bp left Tol2 arm (L). UAS, Gal4-responsive upstream activating sequence; E1b, adenoviral E1b minimal promoter element. (B) Splicing of exon 1 and exon 2 was disrupted in VCAP1X2 mutant (mut) embryos at 24 and 48 hpf. (C) Normal morphology of VCAP1X2 mutants and WT embryos at 48 hpf. EGFP expression was detected in the heart (h), posterior cardinal vein (pcv) and primordial hindbrain channel (phbc) of VCAP1X2 mutant (n = 50 for 48 hpf). Scale bar, 25 μm. (D) Expression of EGFP and VCAP1X2 (red) is shown in heart ventricles of Tg(myl7: EGFP; myl7: H2AFZ mcherry) embryos at 96 hpf. No VCAP1X2 expression was detected in the ventricle of homozygous VCAP1X2 mutant heart (n = 15 per condition, N = 3). Scale bar, 50 μm. (E) Expression of VCAP1X2 at shield (a), 5 somite (s) (b), 18 s (c,d), 24 (e–g), 30 (h–j), 48 (k,l) and 72 (m) hpf stages. VCAP1X2 was co-expressed with myl7 in the myocardium of embryos at 24 and 30 hpf (g,j). Scale bars, 30 μm. Co-localization of VCAP1X2 and GFP was detected in phbc (n,o) and pcv (p,q) of Tg(fli1:GFP) embryos at 48 hpf (n = 10). Arrows indicate heart. a, atrium; h, heart; v, ventricle. Scale bars, 50 μm. (F) (a) VCAP1X2 (red) was expressed in the plasma membrane of ventricular myocardium cardiomyocytes labeled with EGFP in Tg(myl7:EGFP; myl7:H2AFZ mCherry) transgenic embryos at 96 hpf. (b) VCAP1X2 was not expressed in EGFP-labeled ventricular epicardium cells in Tg(tcf21:NTR; tcf21:nucEGFP) transgenic embryos at 96 hpf. (c) VCAP1X2 was also not expressed in the EGFP-labeled ventricular endocardium of Tg(fli1:GFP) transgenic embryos at 96 hpf (n = 15 per condition, N = 3). Nuclei were stained by DAPI. Scale bar, 5 μm.
|
