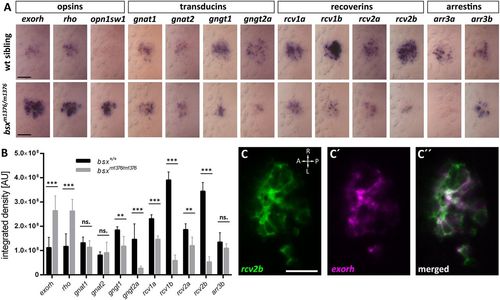
Expression of genes encoding phototransduction factors is altered in bsx mutants. (A) Expression of phototransduction factor genes was analyzed by WISH in embryos at 78 hpf. Genotypes are indicated on the left and gene expression analyzed is indicated above the images. At the top, different biochemical classes of phototransduction factors are indicated. Anterior is to the left of each image. For each genotype and gene expression, n=7 embryos were analyzed. (B) For each individual stained embryo, stain density was measured and integrated over the PC region to evaluate changes in the number of cells expressing a marker or in expression level (method outline in Fig. S10). Significance was determined through Wilcoxon–Mann–Whitney test. **P≤0.01; ***P≤0.001. ns, not significant. (C-C″) Single z-plane (1.5 µm) from confocal stack of wild-type PG (dorsal view) fixed 3 dpf and analyzed by double-fluorescent WISH for expression of rcv2b [(C) green], exorh [(C′) magenta]; (C″) shows merged channels. Orientations as indicated in (C). Scale bars: 30 µm (A) and 20 µm (C-C″).
|
