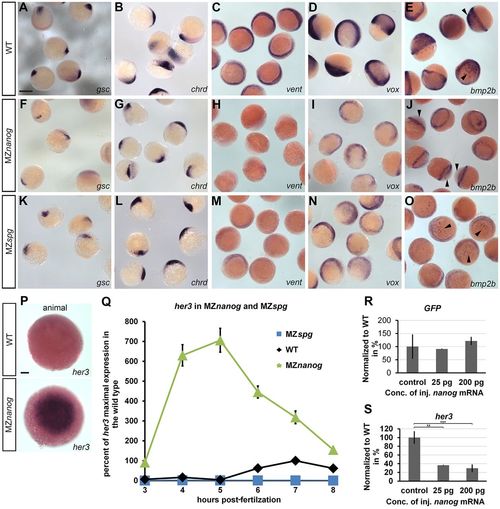
Nanog is required for the expression of the ventral genes bmp2b, vox and vent and for the proper expression levels of the neural gene her3. (A-O) In situ hybridization for dorsal- and ventral-specifying genes was performed in parallel using wild type (WT), MZnanog and MZspg at the shield stage. The dorsal markers gsc (A,F,K) and chrd (B,G,L) are slightly reduced in MZnanog embryos. vent expression (C,H,M) is not detectable in MZnanog but is visible although reduced in MZspg. vox (D,I,N) and bmp2b (E,J,O) expression is reduced in the mesoderm and missing from the ectoderm of MZnanog (arrowheads), whereas in MZspg expression in both tissues is reduced, but detectable. (P) In situ hybridization at 4.7 hpf for her3 in WT and MZnanog (animal view). At this stage, her3 in the WT is expressed in presumptive neural ectoderm (Hans et al., 2004). Because of the upregulation in the MZnanog mutant, the staining reaction was stopped before this staining was visible. (Q) her3 time curve generated by quantitative real-time PCR on WT, MZnanog and MZspg. Embryos were collected at 1 h intervals from 3 hpf to 8 hpf. All expression values were normalized to her3 maximal expression in WT (7 hpf). Error bars represent s.d.; n=3. (R,S) Overexpression of Nanog in Tg(her3enh1-GFP) embryos changes her3 levels. We injected nanog or control mRNA in Tg(her3enh1-GFP) transgenic embryos at the 1-cell stage and performed quantitative RT-PCR on shield stage-embryos measuring changes of her3 and GFP RNA levels. Overexpression of Nanog did not change GFP levels (R) but repressed endogenous her3 (**P<0.001, ***P<1*E−05, Student's t-test) (S). Error bars represent s.d., n=3. Scale bars: 700 µm (A-O); 100 µm (P).
|
