
Fig. 3
- ID
- ZDB-FIG-180104-3
- Publication
- Djenoune et al., 2017 - The dual developmental origin of spinal cerebrospinal fluid-contacting neurons gives rise to distinct functional subtypes
- Other Figures
- All Figure Page
- Back to All Figure Page
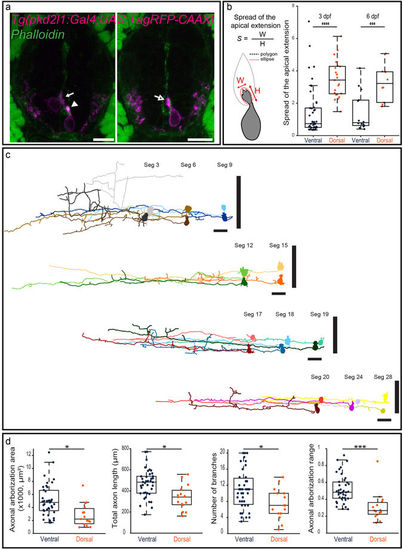
Morphological analysis of CSF-cNs reveals heterogeneous shapes of apical extension and axonal projections. (a) Transverse sections showing ventral and dorsal TagRFP-CAAX+ CSF-cNs (magenta) at 3 dpf reflecting the diversity of morphologies of the apical extension. The apical extension of all dorsal CSF-cNs spreads along the central canal border (arrow) while most ventral CSF-cNs (86.7%) form compact extensions (arrowhead). The small remaining subpopulation of ventral CSF-cNs exhibits the typical spread of dorsal apical extensions (arrow with empty head; Phalloidin staining, green). (b) Schematics of the analysis of the apical extension performed on each cell and statistical analysis comparing the size of the apical extension between ventral and dorsal CSF-cNs at 3 dpf (n = 45 versus 21) and 6 dpf (n = 14 versus 10). The apical extension of dorsal CSF-cNs extends more than for ventral CSF-cNs (two-sample t-tests, p < 5 · 10−7) and this difference persists at later stages (6 dpf, p < 0.002). (c) The reconstruction from dorsal (light shade) and ventral (dark shade) CSF-cNs from different segments (Seg) illustrates the diversity of axonal morphologies CSF-cNs between the two types along the spinal cord (n = 11 for each type). Vertical black bars represent the dorso-ventral limits of the spinal cord. Cells are positioned according to their dorso-ventral (D-V) position with dorsal edge set to 1 and ventral to 0. (d) Comparison of ventral and dorsal CSF-cNs for axonal arborization area, total axon length, number of branches and axonal arborization dorso-ventral range (n = 39 and 15 cells respectively). Ventral CSF-cNs have a wider axonal arborization (p < 0.003), a longer axon (p = 0.0014), reach more ventral domains of the spinal cord (p < 9 · 10−4), and cover a larger dorso-ventral (D-V) range (p < 2 · 10−4) with more axonal branches (p < 0.02). Two-sample t-tests were performed to compare the two populations. Scale bar = 10 μm (a) and 20 µm (c). |
| Gene: | |
|---|---|
| Fish: | |
| Anatomical Terms: | |
| Stage: | Protruding-mouth |