
Fig. 3
- ID
- ZDB-FIG-170809-5
- Publication
- Mesureur et al., 2017 - Macrophages, but not neutrophils, are critical for proliferation of Burkholderia cenocepacia and ensuing host-damaging inflammation
- Other Figures
- All Figure Page
- Back to All Figure Page
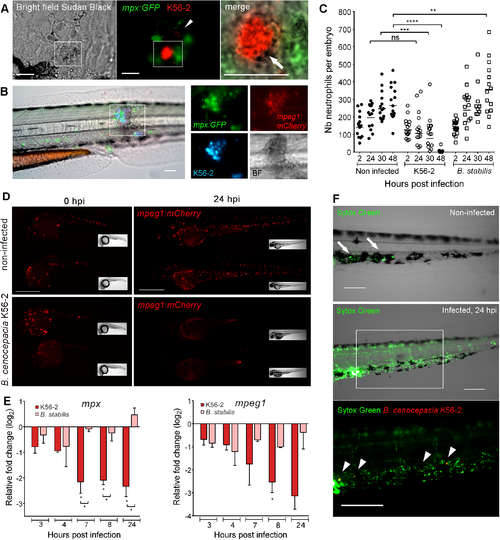
Acute, but not persistent infection results in systemic phagocyte death. (A) Sudan black staining of an mpx:GFP embryo (24 hpi), injected with ~45 CFU B. cenocepacia K56-2. Bright field, fluorescence and merged images showing recruited neutrophils (green) that release granules (stained by Sudan black as black deposit, white arrow) close to an infected cell containing red fluorescent bacteria. Arrow head, individual bacteria. Scale bars, 50 μm. (B) Image of the trunk region of an mpx:GFP; mpeg1:mCherry embryo 24 h post iv injection in the blood island with B. cenocepacia K56-2 (Turquoise), showing neutrophils (green) and macrophages (red) infiltrated in an infection site with multiple infected cells. BF, Bright field image, showing tissue damage. Scale bar, 50 μm. (C) Mean neutrophil numbers in non-infected control and mpx:GFP embryos injected at 50 hpf with B. cenocepacia K56-2 or B. stabilis LMG14294. See also S5B Fig and S5C Fig. (D) Mpeg1:mCherry embryos showing reduced macrophage numbers (red) at 24 hpi in B. cenocepacia K56-2-infected (~45 CFU) compared to non-infected control embryos. Scale bars, 0.5 mm. See S5D Fig for quantification. (E) Mean relative mpx and mpeg1 gene expression level (qRT-PCR) in embryos injected with on average 234 CFU of B. cenocepacia K56-2 (red bars) or 123 CFU of B. stabilis LMG14294 (pink bars) each normalised to a PBS-injected control group at each time point and analysed using Anova (error bars, SEM). Two independent experiments. Asterisks below each bar indicate significance compared to the PBS control at each time point, significance between groups per time point is indicated with a horizontal line. (F) Non-infected and B. cenocepacia K56-2 (~50 CFU, Turquoise indicated in red for better visualization) infected embryos at 24hpi with the cell-impermeable dye Sytox Green. Arrows, dead cells due to DMSO injection. Arrow heads, bacterial clusters. Scale bars, 100 μm. See also S5F Fig. (C). Each data point represents an individual embryo. (C,E) * p ≤ 0.05; ** p ≤ 0.01; *** p ≤ 0.001; **** p ≤ 0.0001; ns: non-significant. See materials and methods for statistical tests. See also S5 Fig. |
| Genes: | |
|---|---|
| Fish: | |
| Condition: | |
| Anatomical Terms: | |
| Stage Range: | Prim-15 to Long-pec |
| Fish: | |
|---|---|
| Conditions: | |
| Observed In: | |
| Stage Range: | Prim-15 to Day 4 |