
Fig. 6
- ID
- ZDB-FIG-161221-39
- Publication
- Chen et al., 2016 - MicroRNA-126a Directs Lymphangiogenesis Through Interacting With Chemokine and Flt4 Signaling in Zebrafish
- Other Figures
- All Figure Page
- Back to All Figure Page
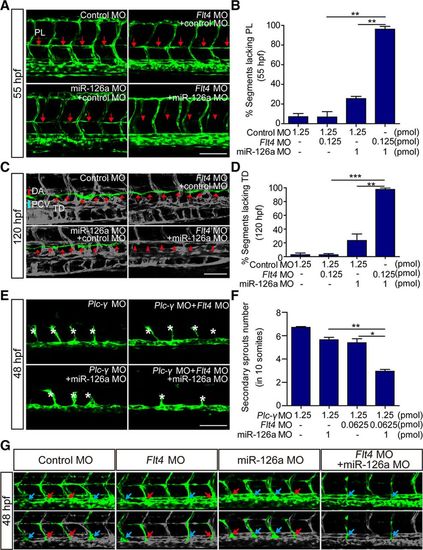
MiR-126a acts synergistically with Flt4 signaling to regulate lymphangiogenic sprouts formation. In all panels, the head of embryo faces left, and dorsal is up. A, Confocal images of trunk vessels at 55 hours post fertilization (hpf). Red arrows indicate normal parachordal lymphangioblast (PL), and red asterisks show the absence of PL. Scale bar, 100 μm. B, Quantification of the PL defects in control and miR-126aKD embryos at 55 hpf. n (from 3 independent biological replicates)=750, 1550, 980, and 1300 for control morpholino (MO), control MO+Flt4 MO, control MO+miR-126a MO, and miR-16a MO+Flt4 MO, respectively. Compared with single-knockdown groups, the PL was more severely impaired in double morphants (**P<0.01 vs Flt4 MO; **P<0.01 vs miR-126a MO). C, Confocal images of thoracic duct (TD) at 120 hpf. White arrows show the normal TD, and white arrowheads denote the absence of TD. Scale bar, 100 μm. D, Quantification of TD defects in control and miR-126a morphants at 120 hpf. Compared with single-knockdown groups, TD was more severely impaired in double morphants (***P<0.01 vs Flt4 MO; **P<0.01 vs miR-126a MO). E, Confocal images of trunk vessels in 48 hpf embryos injected with MOs. The secondary sprouts were dramatically reduced in miR-126a/Flt4/ Plc-γ triple-knockdown embryos. Scale bar, 100 μm. F, Quantification of posterior cardinal vein (PCV) sprouts defects in morphants at 48 hpf. n (from 4 independent replicates)=54, 49, 42, and 43 for Plc-γ MO, Plc-γ/miR-126a double MO, Plc-γ/Flt4 double MO, and Plc-γ/miR-16a/Flt4 triple MO, respectively. Compared with double-knockdown groups, PCV sprouts were more severely impaired in triple morphants (*P<0.01 vs Flt4/Plc-γ double MOs; **P<0.001 vs miR-126a/Plc-γ double MOs). G, Confocal images of trunk vessels in 48 hpf embryos showing normal angiogenic PCV sprouts. The blue arrows indicate the connection of angiogenic PCV sprouts to the primary intersegmental vessel (ISV). The red arrows show the lymphangiogenic PCV sprouts. Scale bar, 100 μm. DA indicates dorsal aorta. |
| Fish: | |
|---|---|
| Knockdown Reagents: | |
| Observed In: | |
| Stage Range: | Long-pec to Day 5 |