
Fig. 2
- ID
- ZDB-FIG-161018-2
- Publication
- Lu et al., 2016 - IGFBP1 increases β-cell regeneration by promoting α- to β-cell transdifferentiation
- Other Figures
- All Figure Page
- Back to All Figure Page
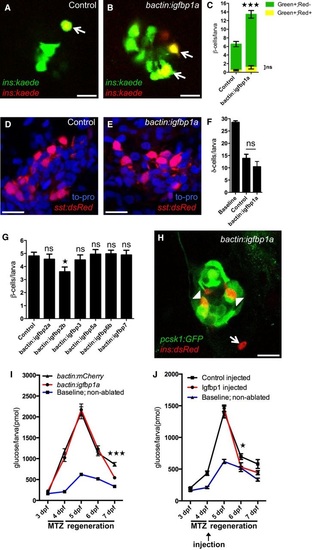
Igfbp1a′s effect on β-cell regeneration is specific and functionally relevant A-C. Igfbp1a promotes βcell regeneration, rather than βcell survival. To trace β cells, we exposed Tg(ins:kaede) larvae to UV light (which causes the existing Kaede protein to switch from emitting green fluorescence to emitting red fluorescence) just before ablating the β cells by MTZ treatment from 3 to 4 dpf. After regeneration, the newly formed β cells are green, whereas the β cells that survived ablation are yellow (overlap of green and red). Representative confocal images (A, B) at 6 dpf of control and bactin:igfbp1a-overexpressing Tg(ins:kaede);Tg(ins:CFPNTR) transgenic larvae; arrows indicate surviving (yellow) β cells. Scale bars: 10 µm. (C) Quantification of βcell regeneration (green bars) and βcell survival (yellow bars) per larva at 6 dpf. ***P < 0.001; n = 20 larvae in the control group, n = 27 larvae in the bactin:igfbp1a-overexpressing group. D-F. Igfbp1a does not promote δcell regeneration. We treated control and bactin:igfbp1a-overexpressing Tg(sst:flagNTR);Tg(sst:dsRed) larvae with MTZ from 3 to 4 dpf to ablate δ cells, and then allowed them to regenerate until 6 dpf. Representative confocal images (D, E) at 6 dpf of control and bactin:igfbp1a-overexpressing larvae showing comparable number of δ cells after 2 days of regeneration. Scale bars: 15 µm. (F) Quantification of the total number of δ cells per δcellablated larva at 6 dpf compared to the baseline number of δ cells in nonablated control larvae. ns, P = 0.2325; n = 13 in the control group, n = 7 in the bactin:igfbp1a group. G. Other Igfbps do not promote βcell regeneration. We injected Tg(ins:kaede);Tg(ins:CFPNTR) transgenics with either transposase mRNA (control; n = 31) or transposase mRNA + one of six different igfbps, igfbp2a (n = 25), igfbp2b (n = 25), igfbp3 (n = 26), igfbp5a (n = 17), igfbp6b (n = 34), and igfbp7 (n = 17), treated them with MTZ from 3 to 4 dpf to ablate their β cells, and then quantified their β cells after 2 days of regeneration, at 6 dpf; ns=nonsignificant (igfbp2a P = 0.986, igfbp3 P = 0.979, igfbp5a P = 0.999, igfbp6b P = 0.997, and igfbp7 P = 0.999); igfbp2b *P = 0.037. H. Tg(pcsk1:GFP) is expressed in regenerating β cells within the islet (arrowheads), but not outside the islet (arrow), at 6 dpf in larvae overexpressing igfbp1a. Scale bar: 15 µm. I, J. Freeglucose levels during βcell regeneration in control (bactin:mCherry) and bactin:igfbp1a-overexpressing Tg(ins:kaede);Tg(ins:CFPNTR) larvae (I), as well as in Tg(ins:kaede);Tg(ins:CFPNTR) larvae injected in the pericardial sac at 4 dpf with 1 ng of recombinant mouse Igfbp1 (J). We treated larvae with MTZ from 3 to 4 dpf to ablate their β cells and monitored their freeglucose levels at 3-7 dpf. Freeglucose levels were significantly lower after genetic igfbp1a overexpression or Igfbp1protein injection (red lines) than in controls (black lines) at 7 and 6 dpf, respectively. Baseline reference levels of free glucose throughout development are shown for a different set of larvae without βcell ablation. n = 24 larvae (four pools of six larvae) per data point; ***P < 0.001, *P < 0.05. |
| Genes: | |
|---|---|
| Fish: | |
| Conditions: | |
| Anatomical Terms: | |
| Stage: | Day 6 |