|
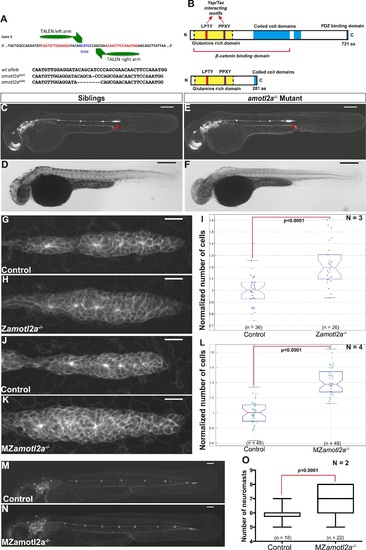
amotl2a mutants phenocopy the morphant phenotype. (A) Scheme showing the transcription activator-like effector nuclease (TALEN) target site in the amotl2a locus with the left and right TALEN-binding sites in red separated by the spacer including the restriction site used for screening (blue) (top). Alignment of the two conserved amotl2a mutant alleles with the corresponding wild-type sequence showing the deleted nucleotides (bottom). (B) Scheme comparing the functional domains present in the wild-type Amotl2a protein (721aa long) and the putative truncated proteins (272aa +17 or +9 missense aa for allele fu45 and fu46, respectively). (C–F) 36 hpf cldnb:gfp wild-type sibling (C, D) or amotl2a/ mutant embryo (E, F) imaged with fluorescent (C, E) or transmitted light (D, F). (G, H, J, K) MIP of Z-stacks of pLLP in cldnb:gfp embryos with the indicated genetic background. (I, L) Boxplots comparing the cell numbers between the indicated genetic backgrounds. (M, N) MZamotl2a/ mutant embryo (N) showing an extra deposited neuromast as compared to a wild-type sibling embryo (M). (O) Boxplot showing the corresponding quantification (Figure 4—source data 1, 2; Figure 4—figure supplements 1, 2, Figure 4—source data 3, 4).
|