
Fig. 2
- ID
- ZDB-FIG-151006-3
- Publication
- Nguyen Chi et al., 2015 - Identification of polarized macrophage subsets in zebrafish
- Other Figures
- All Figure Page
- Back to All Figure Page
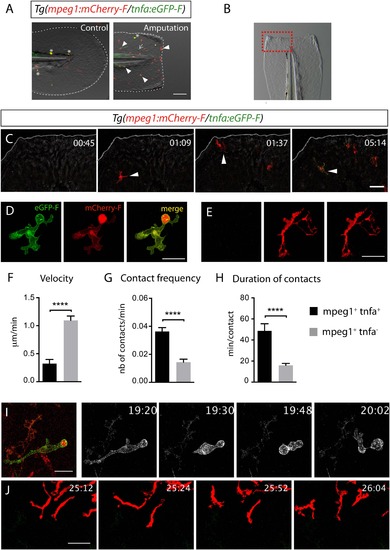
Activation of tnfa+ macrophages in (tnfa:eGFP-F/mpeg1:mCherry-F) transgenic larvae upon E. coli infection. (A) Diagram showing the site where Crimson E. coli or non-fluorescent E. coli (blue) were injected in the muscle of 3 dpf Tg(mpeg1:mCherryF/tnfa:eGFP-F) larvae. The red dotted box represents the region imaged by confocal microscopy. (B) Tg(mpeg1:mCherryF/tnfa:eGFP-F) larvae were infected with crimson-expressing E. coli (blue) at 3 dpf in the muscle and imaged from 30 min pi to 10 hr 30 min pi every 3 min 30 s. Representative time-lapse maximum projections show the expression of tnfa (green) induced in myeloid-like cells at the infection site from 3 hpA. The time pA is shown on top right corner, scale bar = 25 µm. (C) Maximum projections of confocal analysis of GFP-F (green) and mCherryF (red) expressions in Tg(mpeg1:mCherryF/tnfa:eGFP-F). Larvae were previously infected with E. coli at 3 dpf in the muscle and imaged at 6 hpi. Arrowheads show macrophages expressing tnfa. Scale bar on left panels = 20 µm and on right panels = 10 µm. |
| Genes: | |
|---|---|
| Fish: | |
| Condition: | |
| Anatomical Terms: | |
| Stage: | Protruding-mouth |