
Fig. 2
- ID
- ZDB-FIG-150713-23
- Publication
- Fadeev et al., 2015 - Tight junction protein 1a regulates pigment cell organisation during zebrafish colour patterning
- Other Figures
- All Figure Page
- Back to All Figure Page
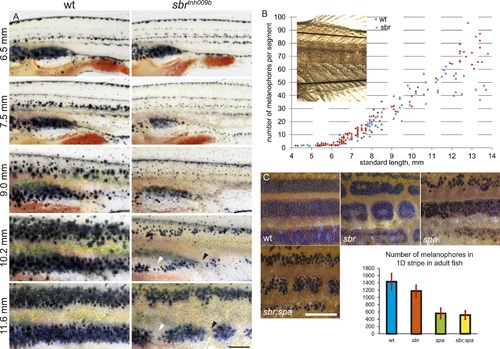
(A) Pigment pattern during metamorphosis in the mid-trunk of individual wild type and sbr mutant fish. Arrowheads: forming interruptions. White arrowheads: disappearing melanophores (N = 6). Scale bar: 1 mm. (B) Average number of melanophores per segment in the first two dark stripes in wild type and mutant fish plotted against standard length. Red circles—individual wild type fish; blue squares—individual sbr fish. Inset shows the area where melanophores were counted. Distributions of melanophore numbers in mutants and wild type fish do not differ significantly until the 10 mm stage as shown by Kolmogorov–Smirnov statistics. At 10–14 mm stages the distributions are different with p-values < 0.05. (C) Close-ups of mid-trunk regions of adult wild type, sbr, spa and spa;sbr and melanophore numbers in a dark stripe dorsal to the first light stripe of adult fish. Red lines—standard deviation. Scale bar: 2 mm. |
| Fish: | |
|---|---|
| Observed In: | |
| Stage Range: | Days 21-29 to Adult |