|
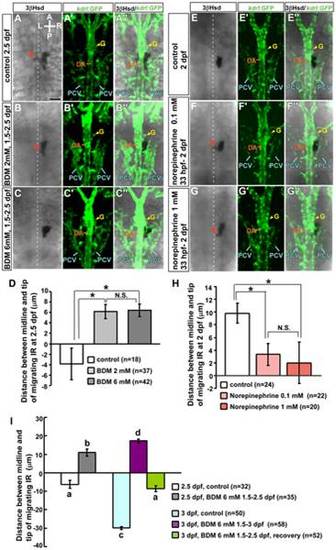
Effects of 2,3-BDM and norepinephrine on morphogenetic movements of interrenal tissue. For repression of blood flow, Tg(kdrl: GFP)s843 embryos were treated with (A–A′′) vehicle (control), or 2,3-BDM at a concentration of (B–B′′) 2 mM or (C–C′′) 6 mM from 1.5 dpf. A suppression of the medial extension of steroidogenic cells was observed in 2,3-BDM-treated embryos at 2.5 dpf, while the morphology of the DA and the pronephric glomerulus (yellow arrowheads) appeared unperturbed. Protrusions (red arrow) formed at the lower concentration; the phenotype was more severe at the higher concentration. For acceleration of blood flow, Tg(kdrl: GFP)s843 embryos were treated with (E-E′′) vehicle (control), or norepinephrine at a concentration of (F–F′′) 0.1 mM or (G-G′′) 1 mM from 33 hpf. An enhancement of interrenal medial extension, as evidenced by the formation of protrusions, was observed in norepinephrine-treated embryos at 2 dpf. The effects of 2,3-BDM and norepinephrine treatments on interrenal migration were quantified in (D) and (H), respectively. The distance between the midline and migrating tip of steroidogenic tissue was designated as positive if the migrating tip had not reached the midline, and negative if the tip had migrated across the midline. *P<0.05; N.S., not significant (Student′s t-test). (I) Suppressing effect of interrenal cell migration by 2,3-BDM at 6 mM from 1.5 dpf was reversible at 3 dpf, as the 2,3-BDM applied from 1.5 dpf was washed out at 2.5 dpf for restoring blood flow. The interrenal tissue in recovered embryos extended across the midline at 3 dpf and displayed a migration distance not significantly different from that in control embryos at 2.5 dpf. Histograms with different letters above them are significantly different (ANOVA and Duncan′s multiple test, P<0.05). A, anterior; P, posterior; L, left; R, right. Broken white lines indicate position of the midline. Abbreviations: glomerulus (G), posterior cardinal vein (PCV). Scale bar, 50 µm.
|