
Fig. 3
- ID
- ZDB-FIG-150326-53
- Publication
- Saito et al., 2014 - Telomere distribution pattern and synapsis initiation during spermatogenesis in zebrafish
- Other Figures
- All Figure Page
- Back to All Figure Page
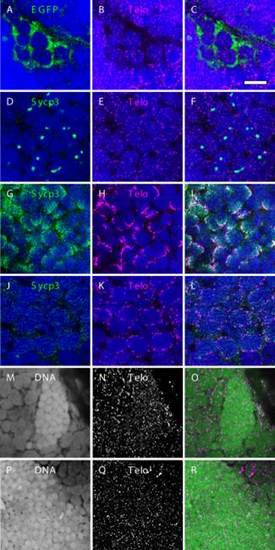
Distribution and assembly of telomeres in zebrafish spermatogenic cells. A–C: Telomeres in spermatogonia. Spermatogonia were identified by EGFP expression in vas::EGFP transgenic zebrafish testis. Panel A shows anti-GFP antibody staining (green), panel B shows FISH signals using a telomere probe (magenta), and panel C shows a merged image of panels A and B. D–L: Telomeres in meiotic spermatocytes. Spermatocytes at preleptotene (D–F), leptotene or early zygotene (G–I), and pachytene (J–L) stages were identified according to their Sycp3 expression patterns. Panels D, G, and J show anti-Sycp3 antibody staining (green); panels E, H, and K show FISH signals using a telomere probe (magenta); and panels F, I, and L show merged images. Nuclei were stained with TO-PRO-3 and are displayed in blue (A–L). M–R: Distributions of telomeres in spermatids (M–O) and sperm (P–R). Panels M and P show nuclear staining with TO-PRO-3, panels N and Q show FISH signals using a telomere probe, and panels O and R show merged images (TO-PRO-3, green; FISH signal, magenta). Scale bar = 10 µm. |
| Genes: | |
|---|---|
| Antibody: | |
| Fish: | |
| Anatomical Terms: | |
| Stage: | Adult |