
Fig. 4
- ID
- ZDB-FIG-150326-28
- Publication
- Schupp et al., 2014 - Transcriptional inhibition of etv2 expression is essential for embryonic cardiac development
- Other Figures
- All Figure Page
- Back to All Figure Page
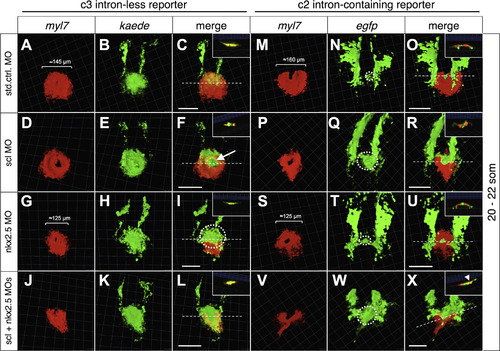
Spatial changes in intron-less c3 and intron-containing c2 transgene expression in scl/nkx2.5 morphant cardiac discs. Display of myl7+ myocardial progenitor cells (red) and concomitant display of cells expressing either c3 kaede+ (A-L) or c2 egfp+ (M-X) reporter transgenes (green) by two-color fluorescent in-situ-hybridization. Merged images are shown in (C, F, I, L) and (O, R, U, X), respectively, with insets showing transverse optical sections at the section plane indicated by dashed lines. In control embryos, the c3 transgene expression shows maximal overlap with the flat and disc-shape myocardial myl7+ expression domain (A-C, similar as in Fig. S2 M-O), but the c2 transgene expression marking the endocardial domain (dashed circle in N) shows minimal overlap (M-O). In scl morphants, the endocardial domains of both c3 (D-F) and c2 (P-R) transgenes were enlarged (indicated by arrow in F and dashed circle in Q), resulting in compaction of the myocardial domain around the enlarged endocardial domain (see insets). In nkx2.5 morphants, the size of the myocardial disc was reduced (compare G and S to A and M), however the myocardial c3 transgene expression domain (G-I) was increased (dashed circle in I). The size of the endocardial domain marked by the c2 transgene was unchanged in nkx2.5 morphant cardiac discs (S-U, dashed circle in T). In double scl/nkx2.5 knockdown embryos, cardiac expression of the intron-less c3 transgene was increased in both endocardial and myocardial domains (J-L), and intron-less c2 transgene expression showed an increase in the endocardial domain (V-X). Note myl7+ c2 transgene expressing cells in scl/nkx2.5 double morphants indicated by arrowhead in the transverse optical section in inset of X. Approximate myocardial domain sizes are given in A, M, G and S. Embryos are 20-22 som in dorsal views with anterior to the top from one c3 line (F5 generation) and one c2 line (F4). Images shown are snapshots from 3D views with bars ≈100 µm in relation to the background grid (1 unit=45.18 µm). Transverse optical sections (insets) were scaled down 0.6×. |
| Genes: | |
|---|---|
| Fish: | |
| Knockdown Reagents: | |
| Anatomical Terms: | |
| Stage: | 20-25 somites |
Reprinted from Developmental Biology, 393(1), Schupp, M.O., Waas, M., Chun, C.Z., Ramchandran, R., Transcriptional inhibition of etv2 expression is essential for embryonic cardiac development, 71-83, Copyright (2014) with permission from Elsevier. Full text @ Dev. Biol.