
FIGURE
Fig. 7
- ID
- ZDB-FIG-150312-34
- Publication
- Junker et al., 2014 - Genome-wide RNA Tomography in the Zebrafish Embryo
- Other Figures
- All Figure Page
- Back to All Figure Page
Fig. 7
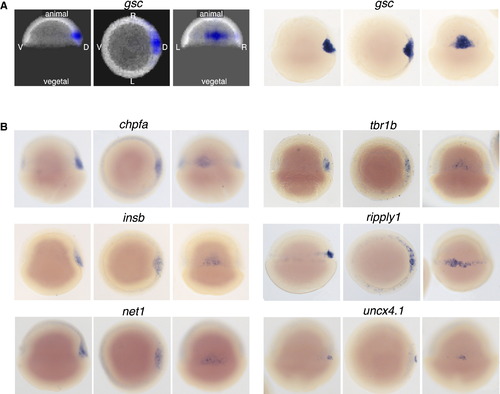
Determining Genes with Similar Expression Patterns in 3D (A) RNA tomography data and in situ validation for gsc. Images show projections of reconstructed expression patterns along different body axes of shield stage embryos and microscopy images taken in the corresponding orientations. Left: lateral view, visualized from left. Middle: animal pole view. Right: dorsal view. (B) Validation of novel genes with inferred expression patterns similar to gsc at shield stage. Panels show microscopy images along different body axes of shield stage embryos. See also Figure S7 and Movies S1 and S2. |
Expression Data
| Genes: | |
|---|---|
| Fish: | |
| Anatomical Term: | |
| Stage: | Shield |
Expression Detail
Antibody Labeling
Phenotype Data
Phenotype Detail
Acknowledgments
This image is the copyrighted work of the attributed author or publisher, and
ZFIN has permission only to display this image to its users.
Additional permissions should be obtained from the applicable author or publisher of the image.
Reprinted from Cell, 159, Junker, J.P., Noël, E.S., Guryev, V., Peterson, K.A., Shah, G., Huisken, J., McMahon, A.P., Berezikov, E., Bakkers, J., van Oudenaarden, A., Genome-wide RNA Tomography in the Zebrafish Embryo, 662-75, Copyright (2014) with permission from Elsevier. Full text @ Cell