
Fig. 6
- ID
- ZDB-FIG-150115-34
- Publication
- Fukuhara et al., 2014 - Visualizing the cell-cycle progression of endothelial cells in zebrafish
- Other Figures
- All Figure Page
- Back to All Figure Page
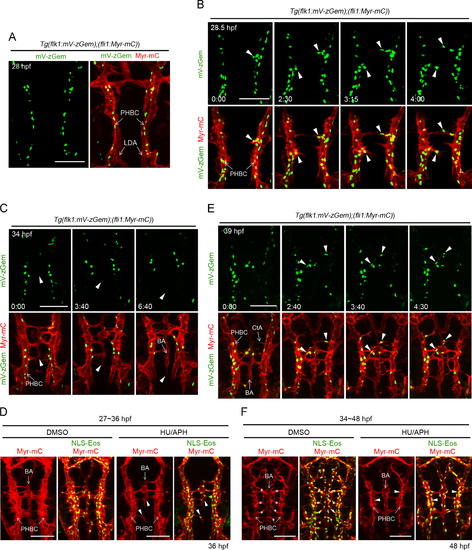
Cell-cycle progression of ECs during formation of hindbrain vasculature. (A) 3D-rendered confocal images of the hindbrain vasculature in Tg(flk1:mV-zGem);(fli1:Myr-mC) embryos at 28 hpf. Left, mVenus image; right, the merged image of mVenus (green) and mCherry. All confocal images in this figure are dorsal views and displayed as anterior to the top. (B, C) 3D-rendered confocal fluorescence image of the hindbrain vasculature in Tg(flk1:mV-zGem);(fli1:Myr-mC) embryos at 28.5 hpf (B) or 34 hpf (C) and the corresponding subsequent time-lapse images at the elapsed time (h:min) indicated at the bottom of the upper panel. Upper, mVenus image; lower, the merged image of mVenus (green) and mCherry. Arrowheads indicate mVenus-positive ECs that sprout from the primordial hindbrain channels (PHBCs) (B) and the ECs that caudally migrate to form the basilar artery (BA) (C). (D) Confocal fluorescence image of the hindbrain vasculature in 36 hpf Tg(fli1:Myr-mC);( flk1:NLS-Eos) embryos treated from 27 hpf with DMSO (left) or HU/APH (right). mCherry and the merged images of mCherry (red) and Eos (green) are shown as indicated at the top. Arrowheads indicate defective formation of the BA. (E) Confocal fluorescence images of the hindbrain vasculature in Tg(flk1:mV-zGem);(fli1:Myr-mC) embryos at 39 hpf and the corresponding subsequent time-lapse images at the elapsed time (h:min) indicated at the bottom of the upper panel are shown, as in B. Arrowheads indicate mVenus-positive ECs that sprout from PHBCs to form the CtAs. (F) Confocal fluorescence images of the hindbrain vasculature in 48 hpf Tg(fli1:Myr-mC);( flk1:NLS-Eos) embryos treated from 34 hpf with DMSO (left) or HU/APH (right) are shown, as in D. Asterisks and arrowheads indicate CtAs and ECs failing to sprout from PHBCs to form the CtAs, respectively. PHBC, primordial hindbrain channels; LDA, lateral dorsal aorta; BA, basilar artery; CtA, central artery. Scale bars, 100 μm (A–F). |
| Genes: | |
|---|---|
| Fish: | |
| Condition: | |
| Anatomical Terms: | |
| Stage Range: | Prim-5 to Long-pec |
Reprinted from Developmental Biology, 393(1), Fukuhara, S., Zhang, J., Yuge, S., Ando, K., Wakayama, Y., Sakaue-Sawano, A., Miyawaki, A., Mochizuki, N., Visualizing the cell-cycle progression of endothelial cells in zebrafish, 10-23, Copyright (2014) with permission from Elsevier. Full text @ Dev. Biol.