
Fig. 1
- ID
- ZDB-FIG-150113-10
- Publication
- Muto et al., 2014 - Nipbl and Mediator Cooperatively Regulate Gene Expression to Control Limb Development
- Other Figures
- All Figure Page
- Back to All Figure Page
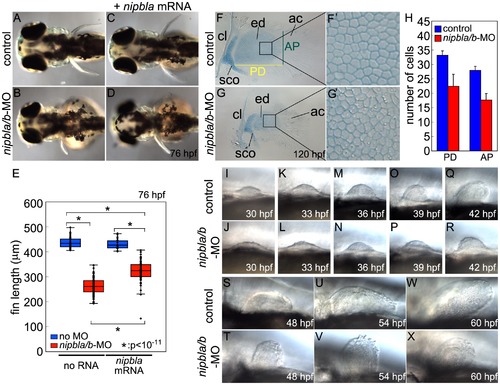
Nipbl knockdown disrupts pectoral fin development. (A–D) Reduced pectoral fins in live Nipbl-deficient embryos at 76 hpf. Dorsal views, anterior to the left. Uninjected control (A), Nipbl-deficient (nipbla/b-MO) (B), injected with 400 pg of nipbla mRNA alone (C) and co-injected with nipbla/b-MO+nipbla mRNA (D). (E) Whisker plots of fin length at 76 hpf; medians: 431.8 μm, n = 50 (control), 258.5 µm, n = 88 (nipbla/b-MOs), 423.0 μm, n = 22 (nipbla mRNA alone), and 319.5 μm, n = 70 (nipbla/b-MOs+nipbla mRNA). p-values are indicated in the graph. (F, F2, G, G2) Alcian blue staining of cartilages in pectoral fins in control (F, F2) and Nipbl-deficient embryos (G, G2) at 120 hpf. F2 and G2 are higher magnification pictures of boxed areas of endoskeletal discs in F and G, respectively. ac, actinotrichs; cl, cleithrum; ed, endoskeletal disc; sco, scapulocoracoid. (H) Numbers of endoskeletal cells in pectoral fins along proximodistal (PD) and anteroposterior (AP) axes (control; n = 13, Nipbl-deficient embryos; n = 16). PD (Ave ± S.D.): 33.2±1.5 (control) and 22.4±4.2 (Nipbl-deficient embryos), p<10-8. AP (Ave ± S.D.): 27.9±1.5 (control) and 17.7±2.2 (Nipbl-deficient embryos), p<10-13. (I-X) Morphology of developing pectoral fin buds in live embryos. Lateral views, anterior and dorsal to the left and top, respectively. |
| Fish: | |
|---|---|
| Knockdown Reagents: | |
| Observed In: | |
| Stage Range: | Prim-15 to Day 5 |