
Fig. 2
- ID
- ZDB-FIG-140812-29
- Publication
- Kessels et al., 2014 - Proteomics analysis of the zebrafish skeletal extracellular matrix
- Other Figures
- All Figure Page
- Back to All Figure Page
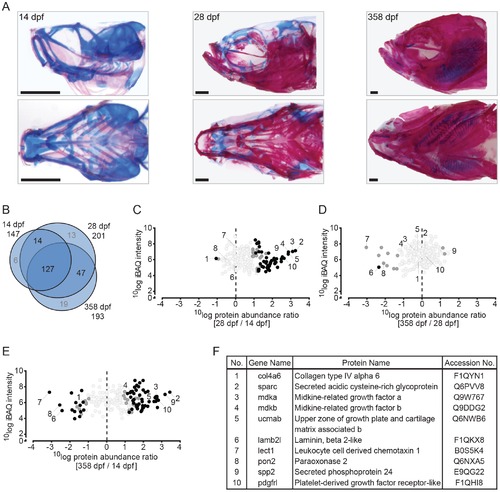
Quantitative analysis of the zebrafish craniofacial skeleton by MS-based proteomics. (A) Alcian blue/alizarin red stain of cartilage/bone structures in the craniofacial skeleton. Lateral (top) and ventral (bottom) images of all three time point used for protein extraction (left to right: 14 dpf, 28 dpf, 358 dpf). (B) VENN diagram of proteins selected for label-free quantification, with areas drawn to represent the number of proteins. Total number of proteins as well as distinct and common proteins are indicated for each time point. Proteins that did not qualify for label-free quantification are depicted in grey. (C-E) Ratio abundance plots showing log total iBAQ intensities versus log protein abundance ratio of the 28/14 dpf (C), the 358/28 dpf (D) and the 358/14 dpf (E) craniofacial skeleton ratios of all the proteins that met the strict criteria for label-free quantification (black circles, significantly differential abundant proteins at FDR = 0.01; dark grey circles, significantly differential abundant proteins at FDR = 0.05; light grey circles, no significant change in abundance). The numbers correspond to the proteins listed in 2F. (F) Table containing several of the significant differentially abundant proteins within the cranial skeleton. Specific proteins are discussed in the text. |
| Genes: | |
|---|---|
| Fish: | |
| Anatomical Term: | |
| Stage Range: | Days 14-20 to Adult |