
Fig. 4
- ID
- ZDB-FIG-140103-3
- Publication
- Yang et al., 2013 - Expression of unc5 family genes in zebrafish brain during embryonic development
- Other Figures
- All Figure Page
- Back to All Figure Page
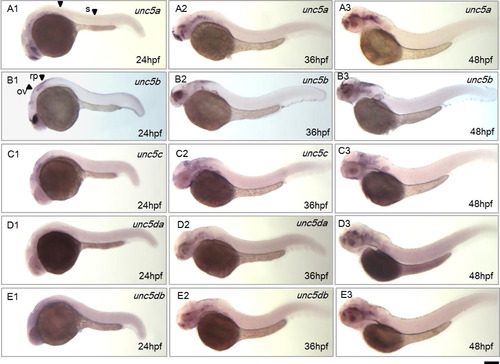
Expression analysis of unc5a, unc5b, unc5c, unc5da and unc5db in zebrafish at 24, 36 and 48 hpf by whole mount in situ hybridization. The probes used for in situ hybridization are listed in the upper right corner of each panel. Developmental stages are indicated in the lower right corners. A1–A3, unc5a gene expression in zebrafish. Arrow heads mark signals in the trunk region. B1–B3, unc5b gene expression in zebrafish. Arrow heads mark signals in the otic vesicle and roof plate. C1–C3, unc5c gene expression in zebrafish. D1–D3, unc5da gene expression in zebrafish. E1–E3, unc5db gene expression in zebrafish. Abbreviations: ov, otic vesicle; rp, roof plate. Scale bar (under E3): 200 μm. |
| Genes: | |
|---|---|
| Fish: | |
| Anatomical Terms: | |
| Stage Range: | Prim-5 to Long-pec |
Reprinted from Gene expression patterns : GEP, 13(8), Yang, B., Peng, G., and Gao, J., Expression of unc5 family genes in zebrafish brain during embryonic development, 311-8, Copyright (2013) with permission from Elsevier. Full text @ Gene Expr. Patterns