
Fig. 9
- ID
- ZDB-FIG-130815-21
- Publication
- Patterson et al., 2013 - Interactions with Iridophores and the Tissue Environment Required for Patterning Melanophores and Xanthophores during Zebrafish Adult Pigment Stripe Formation
- Other Figures
- All Figure Page
- Back to All Figure Page
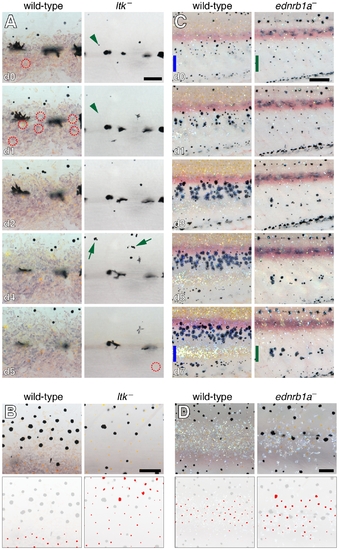
Melanophore and xanthophore development is disrupted in additional iridophore-deficient mutants. (A) Comparison of xanthophore and melanophore development in wild-type and ltk mutants. Shown are details at the horizontal myoseptum from larger images of representative wild-type (ltk/+) and ltk mutant, stage-matched siblings imaged daily (beginning at 6 SSL). In the wild-type, nearly all melanophores persisted through the image series. A xanthophore had already developed at the onset of imaging (day 0, red dashed circle), and additional xanthophores differentiated shortly thereafter. In the ltk mutant, however, melanophores were frequently lost between days (green arrowheads) and melanin-containing debris and extrusion bodies were often apparent (green arrows). Unlike the wild-type, no xanthophores differentiated until day 5 of imaging. (B) During later development (9.6 SSL), xanthophores were confined principally to the interstripe region of the wild-type whereas xanthophore developed widely over the flank in the ltk mutant. The horizontal myoseptum lies at the lower edge of both images. Lower panels show positions of xanthophores in red. (C) Comparison of wild-type and ednrb1a mutant. Shown are ventral flanks of representative stage-matched, sibling wild-type (ednrb1a/+) and ednrb1a mutant larvae imaged daily (8.8–10 SSL). At the onset of imaging, wild-type melanophores are largely absent from a region where the second interstripe will form by day 7 of imaging (blue bars). In ednrb1a mutants, however, melanophores are relatively uniformly distributed in this region at the onset of imaging, and, by day 7 of imaging, formed clusters where the second interstripe would normally form (green bars). Images shown were rescaled to control for growth. (D) Closeups showing reduced iridophores in ednrb1a mutant compared to wild-type (9.0 SSL) as well as wider distribution of xanthophores. Fish in A, B and D were treated briefly with epinephrine prior to imaging. Sample sizes for which complete image series were obtained were: ltk, n = 6; ltk/+, n = 5; ednrb1a, n = 4; ednrb1a/+, n = 5. Scale bars: in (A, d0) 60 μm for (A); in (B) 100 μm for (B); in (C, d0) 200 μm for (C, d0); in (D) 100 μm for (D). |
| Fish: | |
|---|---|
| Observed In: | |
| Stage Range: | Days 7-13 to Adult |