
Fig. 1
- ID
- ZDB-FIG-130102-1
- Publication
- Vemaraju et al., 2012 - A spatial and temporal gradient of fgf differentially regulates distinct stages of neural development in the zebrafish inner ear
- Other Figures
- All Figure Page
- Back to All Figure Page
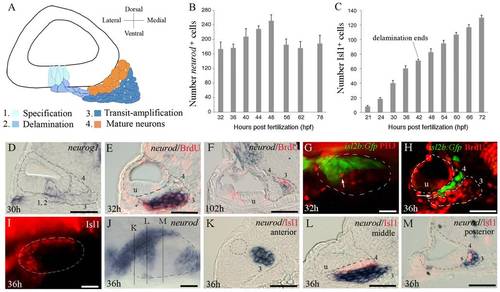
Development of Statoacoustic Ganglion (SAG). (A) Illustration showing the various stages of SAG development. Neuronal precursors (neuroblasts) are specified (1) and delaminate from (2) the floor of the otic vesicle. Neuroblasts undergo a phase of transit-amplification (3) wherein they migrate to a position between the otic vesicle and hindbrain as they continue to proliferate. Neuroblasts finally differentiate into mature neurons (4). (B) Total number of delaminated neurod+ cells within the SAG counted from serial sections at the indicated times (mean ± standard deviation, n = 2 or greater for each time point). (C) total number of Islet-1-positive SAG neurons at the indicated times (mean of total number ± standard deviation, n = 20 for each time point). (D) neurog1 expression at 30 hpf. (E, F) Co-staining for neurod (blue) and BrdU (red) in embryos exposed to BrdU for 6 hours starting at 26 hpf (E) and 96 hpf (F), and then fixed at 32 hpf and 102 hpf, respectively. (G) Co-staining for isl2b:Gfp (green) and phospho-histone H3 (PH3, red) at 32 hpf. Only one mitotic cell (arrow) is seen in the vicinity of the SAG. (H) Co-staining for Islet1 (green) and BrdU (red) at 36 hpf. Only one double-stained cell is visible (arrow). (I-M) Expression of neurod (blue) and Islet-1 (red) at 36 hpf. Mature neurons are labeled with Islet-1 (I) and delaminated progenitor cells express neurod (J). Positions of section-planes in K–M are indicated in (J). (K-L) Transverse sections passing through the anterior (K), middle (L) and posterior (M) regions of the SAG show mostly complementary patterns of neurod and Islet-1. The outer edge of the otic vesicle is outlined in all panels. SAG cells in stages 1-4 of development are indicated in sections, and the position of the utricular macula (u) is indicated. Images of whole-mount specimens (G, I, J) show dorsolateral (G, I) and dorsal (J) views with anterior to the left. Images of transverse sections (C-F, H, K-M) show dorsal to the top and lateral to the left. Scale bar, 25 μm. |
| Genes: | |
|---|---|
| Antibody: | |
| Fish: | |
| Anatomical Terms: | |
| Stage Range: | Prim-15 to Day 4 |