
Fig. 2
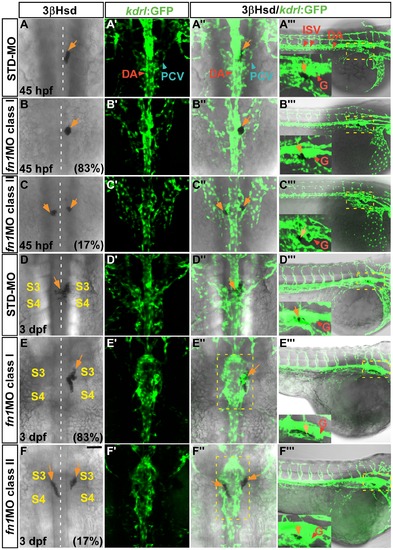
The vascular phenotype and interrenal-endothelial interaction in the fn1 morphant. Sets of confocal images display the interrenal tissue as detected by 3β-Hsd activity staining (orange arrows), and the midtrunk vasculature by green fluorescence, of 45 hpf and 3 dpf Tg(kdrl:EGFP)s843 embryos injected with either STD-MO or fn1MO. Panels (A-F, A′-F′, A′′-F′′) are dorsal views showing the midtrunk of the representative embryo for each phenotypic class, with anterior oriented to the top; while panels (A′′′-F′′′) lateral views of the same embryo with anterior to the right. The outlined peri-interrenal areas in E′′ and F′′ indicate enlarged DA segments. The outlined glomerular (G) and interrenal regions in (A′′′-F′′′) are magnified and annotated in the insets. The angiogenesis of ISV and kidney glomerulus, as well as the association between interrenal and endothelial cells, are not inhibited upon the absence of Fn. Abbreviations: dorsal aorta (DA), posterior cardinal vein (PCV), intersegmental vessel (ISV), glomerulus (G), the third somite (S3), the fourth somite (S4). Scale bar is 50 μM. |
| Gene: | |
|---|---|
| Fish: | |
| Knockdown Reagent: | |
| Anatomical Term: | |
| Stage Range: | High-pec to Protruding-mouth |