
Fig. 4
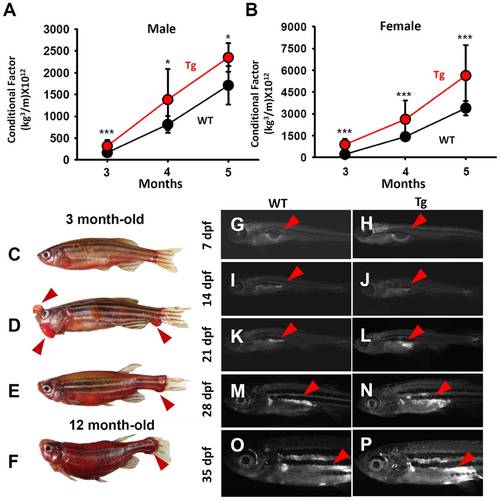
Tg(krt4:Hsa.myrAkt1)cy18 fish display obese phenotype at the adult stage. Comparison of the conditional factor between WT (black) and Tg (red) for either male (A) or female (B) fish aged from 3- to 5-month old. Error bars labeled with stars indicate significant differences as tested by Student’s t-test. Oil Red O stains of fish from either wild-type (C), F0 founder carrying krt4:myrAkt1transgene (D), F1 Tg aged at 3 mpf (E), and F1 Tg aged at 12 mpf (F). Nile red vital staining reveals the lipid accumulation in WT and Tg aged at 7 dpf (G and H), 14 dpf (I and J), 21 dpf (K and L), 28 dpf (M and N) and 35 dpf (O and P). Arrows indicate nile red-positive lipids.WT, wild type; Tg, Tg(krt4:Hsa.myrAkt1)cy18; dpf, day post-fertilization; mpf, month post-fertilization. |
| Fish: | |
|---|---|
| Observed In: | |
| Stage Range: | Days 7-13 to Adult |