
Fig. S3
- ID
- ZDB-FIG-110712-46
- Publication
- Mönnich et al., 2011 - A zebrafish model of Roberts syndrome reveals that Esco2 depletion interferes with development by disrupting the cell cycle
- Other Figures
- All Figure Page
- Back to All Figure Page
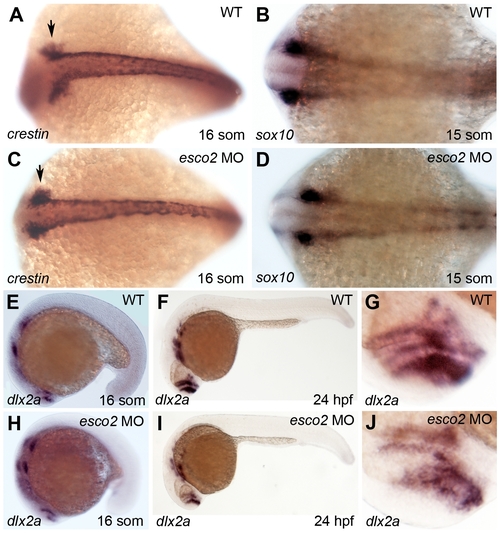
Some neural crest and developmental markers are expressed in a slightly abnormal pattern in esco2 morphants. A, C, Crestin expression at the 16 somite stage. Crestin expressing cells at the anterior side were more condensed in esco2 morphants (C, arrows) than wild type (A). B, D, Sox10 expression was normal in esco2 morphants at the 15 somite stage (D, compared to wild type in B). E–J, Dlx2a expression at 16 somites was normal in esco2 morphants (H, compared to wild type in E). At 24 hpf expression of dlx2a was slightly reduced in the branchial arches and the forebrain of esco2 morphants (I, compared to F). The close-ups on the forebrain show an abnormal dlx2a distribution in esco2 morphants (J, compared to wild type in G). |
| Genes: | |
|---|---|
| Fish: | |
| Knockdown Reagent: | |
| Anatomical Terms: | |
| Stage Range: | 14-19 somites to Prim-5 |