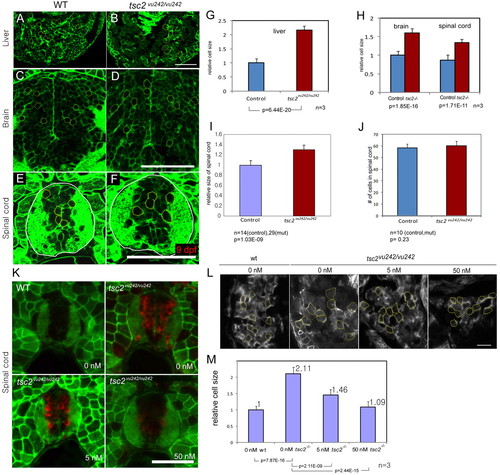
Enlarged hepatocytes and brain and spinal cord neurons in tsc2vu242/vu242 mutant zebrafish and suppression of hepatocyte size by inhibition of TORC1 activity. (A–F) Transverse section of liver (A,B), brain (C,D) and spinal cord (E,F). (G) Hepatocyte size differences in control siblings and tsc2vu242/vu242 mutants are shown. (H) The relative size of neuronal cells in the brain and spinal cord were compared. (I) Homozygous mutant zebrafish have increased size of their spinal cord. (J) Cell number within the spinal cord in control and tsc2vu242/vu242 mutants. (K) Transverse sections through the trunk of 4.5-day-old embryos treated with different concentrations of rapamycin from 3.5 dpf to 4.5 dpf were stained with antibody to phospho-S6 (red). (L) Transverse section of livers from wild-type and tsc2vu242/vu242 mutants without rapamycin treatment, or with 5 nM or 50 nM rapamycin treatment. Cells outlined in yellow were measured and soma size compared. (M) Graph of measurements of relative sizes of cells from embryo shown in L. Numbers on the each bar represent relative cell size. Statistical significance of each analysis is indicated at the bottom of the graph. Scale bars: 50 μm.
|
