
Fig. 5
- ID
- ZDB-FIG-110322-26
- Publication
- Ogura et al., 2009 - Adaptation of GAL4 activators for GAL4 enhancer trapping in zebrafish
- Other Figures
- All Figure Page
- Back to All Figure Page
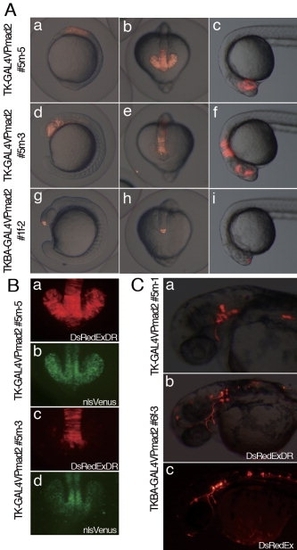
Figure 5. Spatio-temporal reporter expression patterns generated by variant GAL4 activators in selected enhancer-trap lines. A: UAS:DsRedExDR expression in embryos of the TK-GAL4VPmad2 #5m-5 (a–c), #5m-3 (d–f), and TKBA-GAL4VPmad2 #1f-2 (g–i) lines at 11 hpf (a), 15 hpf (b,d,e,g,h), and 24 hpf (c,f,i). Lateral views of whole embryos (a,d,g). Dorsal views of whole embryos (b,e,h). Lateral views with anterior to the left (c,f,i). B: UAS:nlsVenus expression in the TK-GAL4VPmad2 #5m-5 line (b) and the TK-GAL4VPmad2 #5m-3 line (d) at 15 hpf is shown for comparison with UAS:DsRedExDR expression (a,c). Dorsal views with anterior to the bottom. C: Higher magnification images of TK-GAL4VPmad2 #5m-1 (a) and TKBA-GAL4VPmad2 #6f-3 (b,c) highlighting neuronal expression at 36 hpf. The UAS:DsRedEx line was used to obtain brighter red fluorescence in the embryo shown in c. Dorsolateral (a,b) and lateral (c) views of the head region. |
| Genes: | |
|---|---|
| Fish: | |
| Anatomical Terms: | |
| Stage Range: | 1-4 somites to Prim-25 |