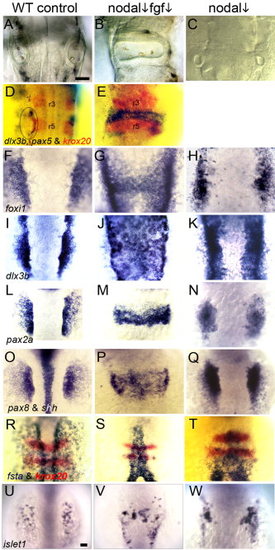
Partial loss of Nodal and Fgf signaling results in medial expansion of otic tissue. In the indicated columns, embryos were treated with 70 μM SB431542 beginning at 0.5 hpf (nodal ↓). A–C: Otic vesicles at 28 hpf in wild-type embryos (A, C), and an fgf8+/- heterozygote (B). D, E: Expression of ear markers dlx3b and pax5 (blue) and the hindbrain marker krox20 (red) at 28 hpf in a wild-type control (D) and a wild-type embryo treated with 1 μM SU5402 beginning at 5.5 hpf (E). F–H: Expression of foxi1 at 11 hpf in wild-type embryos (F, H) and an fgf8+/- heterozygote (G, 2/42 affected). I–K: Expression of dlx3b at 11.5 hpf in wild-type embryos (I, K) and an fgf8+/- heterozygote (J, 4/56 affected). L–N: Expression of pax2a at 12 hpf in wild-type embryos (L, N) and an fgf3+/- heterozygote (M, 7/87 affected). O–Q: Expression of pax8 and shh in wild-type embryos (O, Q) and an fgf8+/- heterozygote (P, 4/51 affected). R–T: Expression of fsta (blue) and krox20 (red) at 11 hpf in wild-type embryos (R, T) and an fgf8+/- heterozygote (S, 40/52 affected). U–W: Expression of islet1 in the trigeminal placode at 11 hpf in wild-type embryos (U, W) and an fgf8+/- heterozygote (V, 3/46 affected). All images show dorsal views (anterior to top). Scale bar = 50 μm.
|
