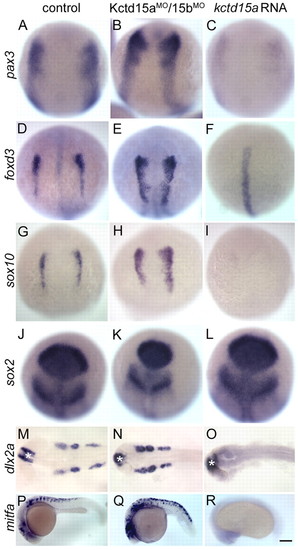
Kctd15 inhibits NC induction and differentiation. (A-R) Control embryos (control MO-injected and uninjected embryos were indistinguishable; A,D,G,J,M,P), Kctd15aMO/15bMO-injected (B,E,H,K,N,Q) and kctd15a mRNA-injected (C,F,I,L,O,R) embryos were fixed at the 1-somite stage (A-L) or at 24 hpf (M-R). Expression of pax3 (A-C), foxd3 (D-F), sox10 (G-I), sox2 (J-L), dlx2a (M-O) and mitfa (P-R) was analyzed by in situ hybridization. Morphants showed expansion of pax3 (B, 42/50), foxd3 (E, 28/35) and sox10 (H, 25/35). kctd15a mRNA-injected embryos showed inhibition of pax3 (C, 38/45), foxd3 (F, 45/50) and sox10 (I, 32/37) in the NC domain, whereas sox2 expression was preserved (K, 25/25; L, 20/20). Expression of dlx2a in the branchial arches was expanded in morphants (N, 32/44) and lost in overexpressing embryos (O, 35/40); mitfa was expanded in morphants (Q, 30/35) and lost in overexpressing embryos (R, 40/40). (A-L) Dorsal views, anterior towards the top; (M-O) dorsal views; (P-R) lateral views, anterior towards the left. Asterisk in M-O indicates dlx2a expression in the forebrain. Scale bar: 100 μm in A-L; 200 μm in M-R.
|
