
Fig. 9
- ID
- ZDB-FIG-090617-38
- Publication
- Bae et al., 2009 - Anatomy of zebrafish cerebellum and screen for mutations affecting its development
- Other Figures
- All Figure Page
- Back to All Figure Page
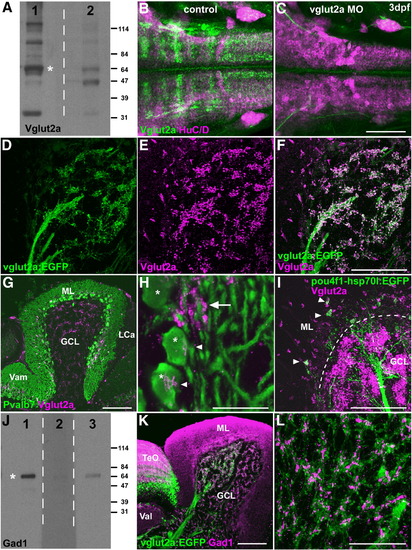
Presynaptic terminals of mossy and climbing fibers. (A) Immunoblotting of brain lysates with an anti-Vglut2a antibody. Rabbit anti-Vglut2a (lane 1) and pre-immune sera (lane 2) were used to detect Vglut2a (asterisk). Several bands other than 64-kD Vglut2a were detected in lane 1, but they are likely non-specific as they were also detected in lane 2. (B, C) Immunostaining of Vglut2a. Larva at 3 dpf that received 4 pg of antisense vglut2a MO (C) and control larva (B) stained with anti-Vglut2a (green) and anti-HuC/D (magenta) antibodies. Dorsal views of the hindbrain regions. Anti-Vglut2a but not anti-HuC/D staining was abolished in the vglut2a morphant hindbrain. (D–F) Co-staining of a Tg(vglut2a:EGFP) brain with anti-Vglut2a and anti-EGFP antibodies. EGFP (green, D), Vglut2a (magenta, E) and merged images (F) are shown. Sagittal section. Note that Vglut2a+ dots are detected in the distal tips (presynaptic terminals) of vglut2a:EGFP+ axons (mossy fibers) in the GCL. (G, H) Co-staining with anti-Vglut2a (magenta) and anti-Pvalb7 (green) antibodies. Low (G) and high (H) magnification views. Vglut2a+ synaptic boutons were detected on the soma (arrowheads) of Purkinje cells (asterisks) or abutting the proximal dendrites of Purkinje cells (arrow). (I) Co-staining of a Tg(pou4f1-hsp70l:EGFP) brain with anti-Vglut2a (magenta) and anti-EGFP (green) antibodies. Vglut2a+ dots were also pou4f1:EGFP+ in the ML (arrowheads), indicating they were presynaptic terminals of climbing fibers. The position of the PCL is indicated by a dotted line. (J) Immunoblotting of brain lysates with anti-Gad1 antibodies. Rabbit anti-Gad1 generated in this study (lane 1), control sera (pre-immune sera, lane 2), and commercially available anti-human GAD1/2 (lane 3) were used to detect zebrafish Gad1 (asterisk). (K, L) Co-staining of the Tg(vglut2a:EGFP) brain with anti-Gad1(magenta) and anti-EGFP (green) antibodies. Low (K) and high (L, in GCL) magnification views. Vglut2a+ and Gad1+ dots were adjacent in the GCL and indicated the cerebellar glomeruli. The abbreviations are as described in Fig. 1. Scale bars: 100 μm (C, F, G, I, K), 50 μm (L), and 20 μm (H). |
Reprinted from Developmental Biology, 330(2), Bae, Y.K., Kani, S., Shimizu, T., Tanabe, K., Nojima, H., Kimura, Y., Higashijima, S.I., and Hibi, M., Anatomy of zebrafish cerebellum and screen for mutations affecting its development, 406-426, Copyright (2009) with permission from Elsevier. Full text @ Dev. Biol.