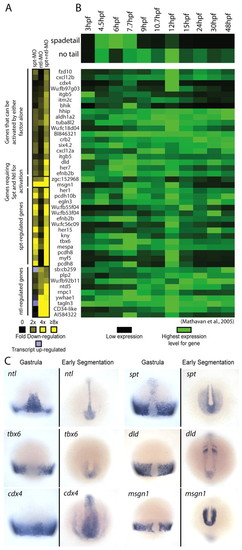
Microarray analysis identifies candidate spt and ntl target genes. (A) Gene expression levels in MO-injected embryos relative to wild-type embryos at 75% epiboly. Downregulation is shown in shades of yellow (2 to >8-fold) and upregulation (2 to 3-fold) is shown in light purple. Only genes with a two-fold or greater decrease in expression level are shown. (B) spadetail (spt) and no tail (ntl) gene expression profiles between 3 and 48 hpf are shown (top) with the expression profiles of putative targets below. These gene expression profiles were retrieved from another dataset (Mathavan et al., 2005). The expression level for each gene was normalized to its highest expression level over the time course. (C) mRNA expression of spt, ntl and four targets at midgastrula (75% epiboly, 8 hpf) and early segmentation (11-13 hpf). These patterns have been previously reported: ntl (Schulte-Merker et al., 1992), spt (Griffin et al., 1998), tbx6 (Hug et al., 1997), dld (Haddon et al., 1998; Hans and Campos-Ortega, 2002), cdx4 (Joly et al., 1992) and msgn1 (Yoo et al., 2003).
|
