
FIGURE
Fig. 2
- ID
- ZDB-FIG-080418-12
- Publication
- Herzog et al., 2003 - Adenohypophysis formation in the zebrafish and its dependence on sonic hedgehog
- Other Figures
- All Figure Page
- Back to All Figure Page
Fig. 2
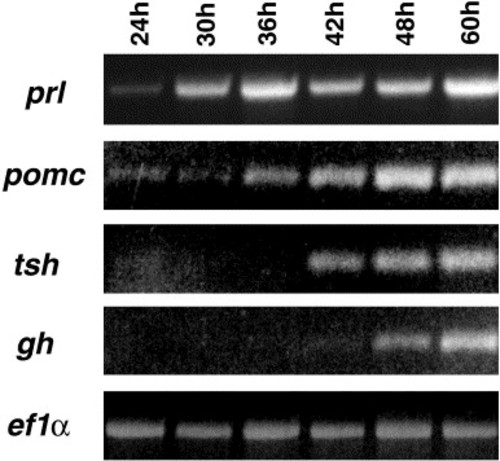
Zebrafish prl, pomc, tsh, and gh show a differential temporal expression profile. RT-PCR analyses at indicates stages (h, hours after fertilization), with ef1α as loading control. prl and pomc are already expressed at 24 h, while tsh and gh transcripts are first detectable from 42 h onwards. |
Expression Data
| Genes: | |
|---|---|
| Fish: | |
| Anatomical Term: | |
| Stage Range: | Prim-5 to Pec-fin |
Expression Detail
Antibody Labeling
Phenotype Data
Phenotype Detail
Acknowledgments
This image is the copyrighted work of the attributed author or publisher, and
ZFIN has permission only to display this image to its users.
Additional permissions should be obtained from the applicable author or publisher of the image.
Reprinted from Developmental Biology, 254(1), Herzog, W., Zeng, X., Lele, Z., Sonntag, C., Ting, J.W., Chang, C.Y., and Hammerschmidt, M., Adenohypophysis formation in the zebrafish and its dependence on sonic hedgehog, 36-49, Copyright (2003) with permission from Elsevier. Full text @ Dev. Biol.