|
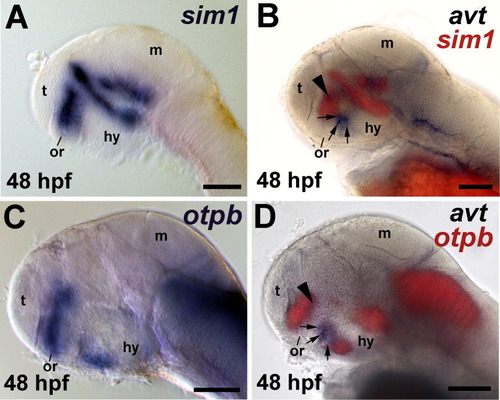
A,C: avt, sim1, and otpb are coexpressed in the dorsal preoptic area, but not in the ventral hypothalamus. avt and sim1 mRNA coexpression, and, avt and otpb coexpression was determined by double-label ISH. Lateral views, dorsal is up and anterior to the left, eyes have been removed. The ages of the embryos are indicated in the left corner in hours postfertilization (hpf). The identity and color of the probes are indicated on each panel. B,D: Images are merged composites of brightfield and epifluorescence images. The avt-expressing cell groups in the ventral hypothalamus are indicated by black arrows, while the avt cell group in the dorsal preoptic area is indicated with a black arrowhead. The location of the optic recess (or) is indicated by a black bar. hy, hypothalamus; m, midbrain; t, telencephalon. Scale bars = 100 μm.
|