
Fig. 1
- ID
- ZDB-FIG-070815-13
- Publication
- Schibler et al., 2007 - A screen for genetic defects of the zebrafish ear
- Other Figures
- All Figure Page
- Back to All Figure Page
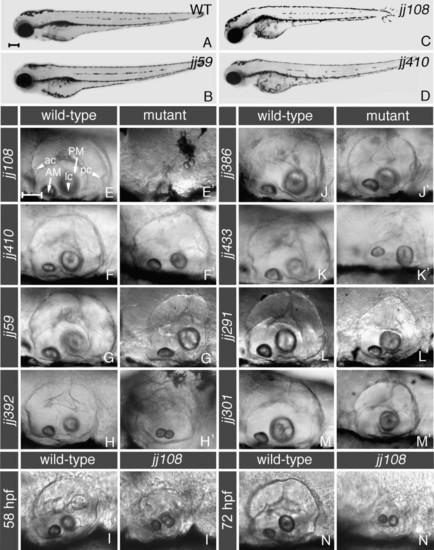
External phenotypes of ear morphology mutants. Panels (A-D) display lateral views of whole larvae at 72 hpf. A wild-type larva (A) is compared to mutant animals at the same stage (B-D). Note that the ear abnormalities of hako mimijj59 (B), mikre uchojj108 (C), and ale uchojj410 (D) mutants appear before other defects, indicating that they do not arise as a secondary consequence of a gross degeneration in the entire embryo. (E-N′) Lateral views of ear morphology in mutant animals, compared to their wild-type siblings. One of the most severe phenotypes is displayed by mikre uchojj108 mutants. Pictured at 144 hpf, the mkojj108 otic vesicle is severely reduced in size and malformed (E′, compare to E). mikre ucho mutant animals form two small otoliths that appear to be fused and their ears gradually decrease in size during larval development, so that they are smaller at 72 hpf (N′) compared to 58 hpf (I′). At 120 hpf, the ale uchojj410 mutant ear (F′) appears less differentiated compared to that of a wild-type sibling (F). Shown at 144 hpf, hako mimijj59 mutant ears display a shortened anterior-posterior axis (G′ compare to G). At 72 hpf, the smujj392 mutant ear is reduced in size in comparison to the wild type (H′ compare to H). pata nopojj386 (J′) mutant ears, pictured at 144 hpf, appear slightly smaller and more symmetric when compared to wild-type siblings (J). The gapajj433 mutant ear appears flat at 144 hpf (K′). Pictured at 144 hpf, the frostbite291 mutant ear is smaller and abnormally pointed on the dorsal side (L′ compare to L). The tone deafjj301 ear is smaller and features a single otolith, at 152 hpf (M′, compare to M). ac, anterior crista; lc, lateral crista; pc, posterior crista; AM, anterior macula; PM, posterior macula. In all panels, anterior is to the left and dorsal is up. Larvae were photographed using DIC optics. See Table 1 for a further description of phenotypes. Scale bar in (A) applies to panels (A-D), and equals 200 μm. Scale bar in (E) applies to the remaining panels, and equals 50 μm. |
| Fish: | |
|---|---|
| Observed In: | |
| Stage Range: | Long-pec to Day 6 |
Reprinted from Mechanisms of Development, 124(7-8), Schibler, A., and Malicki, J., A screen for genetic defects of the zebrafish ear, 592-604, Copyright (2007) with permission from Elsevier. Full text @ Mech. Dev.