
Fig. S4
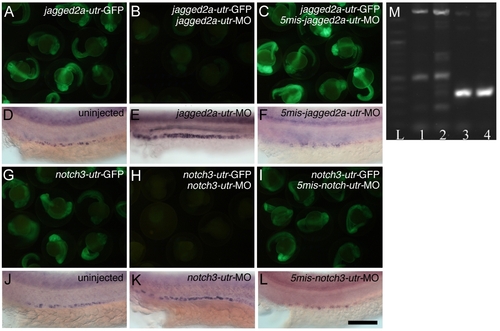
Specificity of jagged2a-utr and notch3-utr Morpholinos on Targeting the 5′ UTR of jagged2a and notch3 and the Effectiveness of the notch3-sp Splicing Morpholino (A–C) Specificity of the jagged2a morpholino. (A) Injection of jagged2a-utr-GFP mRNA at 250 pg produced green fluorescence, (B) coinjection of 0.29 pM jagged2a-utr-MO with 250 pg of jagged2a-utr-GFP mRNA inhibited GFP production, and (C) coinjection of 0.29 pM 5mis-match-jagged2a-utr-MO with 250 pg of jagged2a-utr-GFP mRNA did not inhibit its production. (D–F) Multi-cilia cell probed with rfx2 at 24 hpf in (D) wt embryos, (E) jagged2a-utr morphants, and (F) 5mis-match-jagged2a-utr morphants. Note that the number of multi-cilia cells was increased in jagged2a-utr morphants (Table 1, 93%, n = 231) but not in 5mis-match-jagged2a-utr morphants (97%, n = 35). (G–I) Specificity of the notch3 morpholino. (G) Injection of notch3-utr-GFP mRNA at 250 pg produced green fluorescence, (H) coinjection of 0.38 pM notch3-utr-MO with 250 pg of notch3-utr-GFP inhibited GFP production, and (I) coinjection of 0.38 pM 5mis-match-notch3-utr-MO with 250 pg of notch3-utr-GFP did not inhibit its production. (J–L) Multi-cilia cells probed with rfx2 at 24 hpf in (J) wt embryos, (K) notch3-utr morphants, and (L) 5mis-match-notch3-utr morphants. Note that the number of multi-cilia cells was increased in notch3-utr morphants (Table 1, 97%, n = 33) but not in 5mis-match-notch3-utr morphants (100%, n = 30). (M) Molecular analysis of the effectiveness of the notch3-sp splicing morpholino. RT-PCR of ten embryos generates a 320-bp notch3 fragment in control embryos, bridging part of exon 1 to part of exon 2 at 24 hpf (lane 3) and 48 hpf (lane 4). notch3-sp morpholino-injected embryos analyzed with the same primer sets at 24 hpf (lane 1) and 48 hpf (lane 2) show a larger amplicon of 1,800 bp caused by a nonsplicing of intron 1 and other aberrant splicing variants. Lane L: 100-bp ladder. Bar scale: 1,000 μm (A–C and G–I) and 100 μm (D–F and J–L). |
| Gene: | |
|---|---|
| Fish: | |
| Knockdown Reagents: | |
| Anatomical Term: | |
| Stage: | Prim-5 |