
Fig. 1
- ID
- ZDB-FIG-070316-7
- Publication
- Lopez-Schier et al., 2006 - A two-step mechanism underlies the planar polarization of regenerating sensory hair cells
- Other Figures
- All Figure Page
- Back to All Figure Page
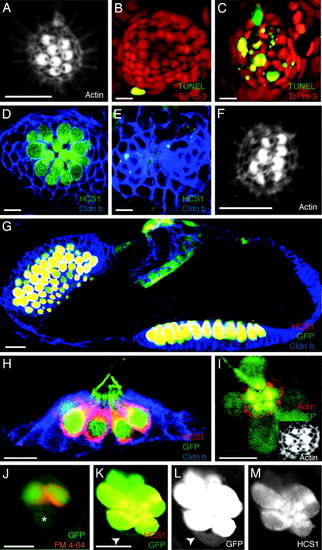
Characterization of hair-cell death and ET4 transgenic zebrafish. (A) In a confocal image of a neuromast in a normal 3-day-old larva, stereocilia are labeled with rhodamine-phalloidin to reveal the polarization of hair bundles toward the animal′s head or tail. (B) In a control larva, only one peripheral cell displays TUNEL staining (green) indicative of apoptosis. To-Pro-3 labeling (red) marks all nuclei. (C) Neomycin treatment increases the number of apoptotic cells at the center of the neuromast. (D) In an untreated animal, immunolabeling with the hair cell-specific marker HCS1 (green) identifies hair cells, and claudin b labeling (blue) designates supporting cells. (E) A neomycin-treated larva lacks hair cells. (F) In a regenerating L1 neuromast, actin staining shows that hair bundles orient along the neuromast′s original, anteroposterior axis of planar cell polarity. (G) GFP-positive hair cells (green) in the ear of a 3-day-old ET4 transgenic animal are also positive for the specific hair-cell marker HCS1 (red). Claudin b immunoreactivity (blue) marks supporting cells. (H) In a lateral view of a neuromast from an ET4 transgenic animal labeled for claudin b (blue) and HCS1 (red), GFP-positive hair cells (green) are also marked by HCS1. (I) Labeling stereocilia with rhodamine-phalloidin (red) confirms that planar cell polarity is normal in an ET4 larva, whose hair cells express GFP (green). (I Inset) Only the actin staining is shown. (J) Incubation of an ET4 larva in FM4–64 (red) reveals a single, weakly GFP-positive cell (asterisk) that does not incorporate this vital dye. (K–M) Labeling of an ET4 larva with HCS1 (red) shows a gradient of intensity for this specific hair-cell marker and for GFP (green) toward the periphery of the neuromast. A single weakly GFP-positive cell at the lower edge of the neuromast (arrowheads) is negative for HCS1. In these and all subsequent figures, the animal′s anterior is oriented to the left and its dorsum is situated to the top. (Scale bars: 10 μm.) |
| Gene: | |
|---|---|
| Fish: | |
| Anatomical Terms: | |
| Stage: | Protruding-mouth |